Fig. 2
Chemical segregation in L1157-B1. The maps are centred at ![]() , δ(J2000) = +68° 01′ 10
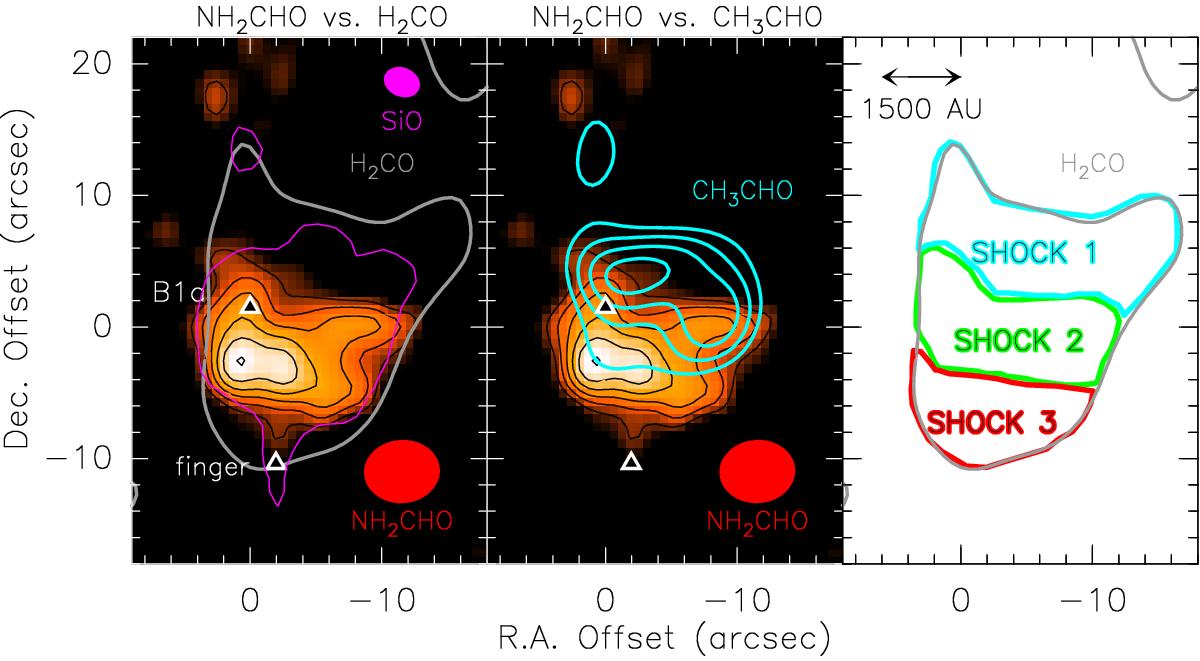
, δ(J2000) = +68° 01′ 10![]() 0. Left panel: p-H2CO (20,2–10,1) integrated emission (grey; Benedettini et al. 2013), and SiO (2–1) (magenta) at low velocity (less than –10 km s-1 with respect to vsys; Gueth et al. 1998) on top of the present NH2CHO line emission map (colour image, black contours). For clarity, for the H2CO and SiO images, only the 3σ (1σ = 3.3 mJy beam-1 km s-1 and 50 mJy beam-1 km s-1 for H2CO and SiO, respectively) contour is reported to show the overall B1 structure (see Fig. A.2 for the complete set of contours). The northern triangle at B1a identifies the youngest position in B1, where the precessing jet driven by L1157-mm impacts the cavity wall (Gueth et al. 1998; Busquet et al. 2014), while the southern triangle denotes the position of the oldest shock, which is identified by the so-called “finger” feature traced by SiO at low velocity. The H2CO image is smoothed to the same angular resolution (red ellipse; see Fig. 1) of the NH2CHO (41,4–31,3) line data. The synthesised beam of the SiO is 2
0. Left panel: p-H2CO (20,2–10,1) integrated emission (grey; Benedettini et al. 2013), and SiO (2–1) (magenta) at low velocity (less than –10 km s-1 with respect to vsys; Gueth et al. 1998) on top of the present NH2CHO line emission map (colour image, black contours). For clarity, for the H2CO and SiO images, only the 3σ (1σ = 3.3 mJy beam-1 km s-1 and 50 mJy beam-1 km s-1 for H2CO and SiO, respectively) contour is reported to show the overall B1 structure (see Fig. A.2 for the complete set of contours). The northern triangle at B1a identifies the youngest position in B1, where the precessing jet driven by L1157-mm impacts the cavity wall (Gueth et al. 1998; Busquet et al. 2014), while the southern triangle denotes the position of the oldest shock, which is identified by the so-called “finger” feature traced by SiO at low velocity. The H2CO image is smoothed to the same angular resolution (red ellipse; see Fig. 1) of the NH2CHO (41,4–31,3) line data. The synthesised beam of the SiO is 2![]() 8 × 2
8 × 2![]() 2, PA = 56°. Middle panel: same as in the left panel for the CH3CHO (70,7–60,6 E+A) velocity-integrated emission (cyan contours; also smoothed to the same beam of the NH2CHO map; first contour and step correspond to 3σ, 4 mJy beam-1 km s-1, and 1σ, respectively; Codella et al. 2015). Right panel: sketch of the three zones identified from the spatial distribution of formamide and acetaldehyde: SHOCK 1 (blue), the northern region, where CH3CHO (and not NH2CHO) is detected; SHOCK 2 (green), where both CH3CHO and NH2CHO are detected; and SHOCK 3 (red), the southern region, where only NH2CHO (and not CH3CHO) is detected. Time increases and chemistry evolves going from SHOCK 1 to SHOCK 3 (see dashed arrows in Fig. 1).
2, PA = 56°. Middle panel: same as in the left panel for the CH3CHO (70,7–60,6 E+A) velocity-integrated emission (cyan contours; also smoothed to the same beam of the NH2CHO map; first contour and step correspond to 3σ, 4 mJy beam-1 km s-1, and 1σ, respectively; Codella et al. 2015). Right panel: sketch of the three zones identified from the spatial distribution of formamide and acetaldehyde: SHOCK 1 (blue), the northern region, where CH3CHO (and not NH2CHO) is detected; SHOCK 2 (green), where both CH3CHO and NH2CHO are detected; and SHOCK 3 (red), the southern region, where only NH2CHO (and not CH3CHO) is detected. Time increases and chemistry evolves going from SHOCK 1 to SHOCK 3 (see dashed arrows in Fig. 1).
Current usage metrics show cumulative count of Article Views (full-text article views including HTML views, PDF and ePub downloads, according to the available data) and Abstracts Views on Vision4Press platform.
Data correspond to usage on the plateform after 2015. The current usage metrics is available 48-96 hours after online publication and is updated daily on week days.
Initial download of the metrics may take a while.