Fig. 9
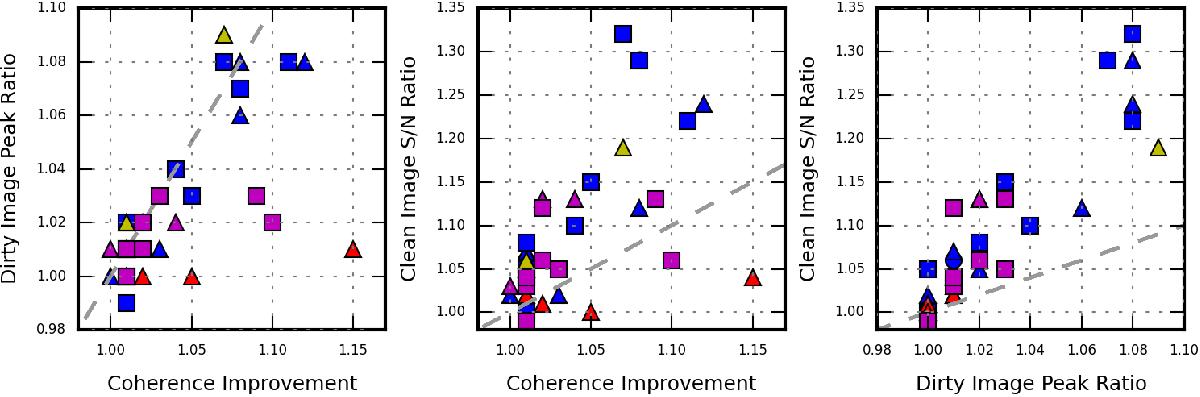
Expected coherence improvement ratio as established using the phase rms as measured over the entire bandpass observation compared to the ratio of the dirty image peak flux values of the bandpass source (left) and against the ratio of S/N values from the cleaned images of the bandpass source (centre). The right figure shows the ratio of the dirty image peak fluxes compared with the ratio of the S/N values from the cleaned images. The symbols and colours are as Fig. 4 and the dashed line indicates a 1:1 relation.
Current usage metrics show cumulative count of Article Views (full-text article views including HTML views, PDF and ePub downloads, according to the available data) and Abstracts Views on Vision4Press platform.
Data correspond to usage on the plateform after 2015. The current usage metrics is available 48-96 hours after online publication and is updated daily on week days.
Initial download of the metrics may take a while.