Fig. 4
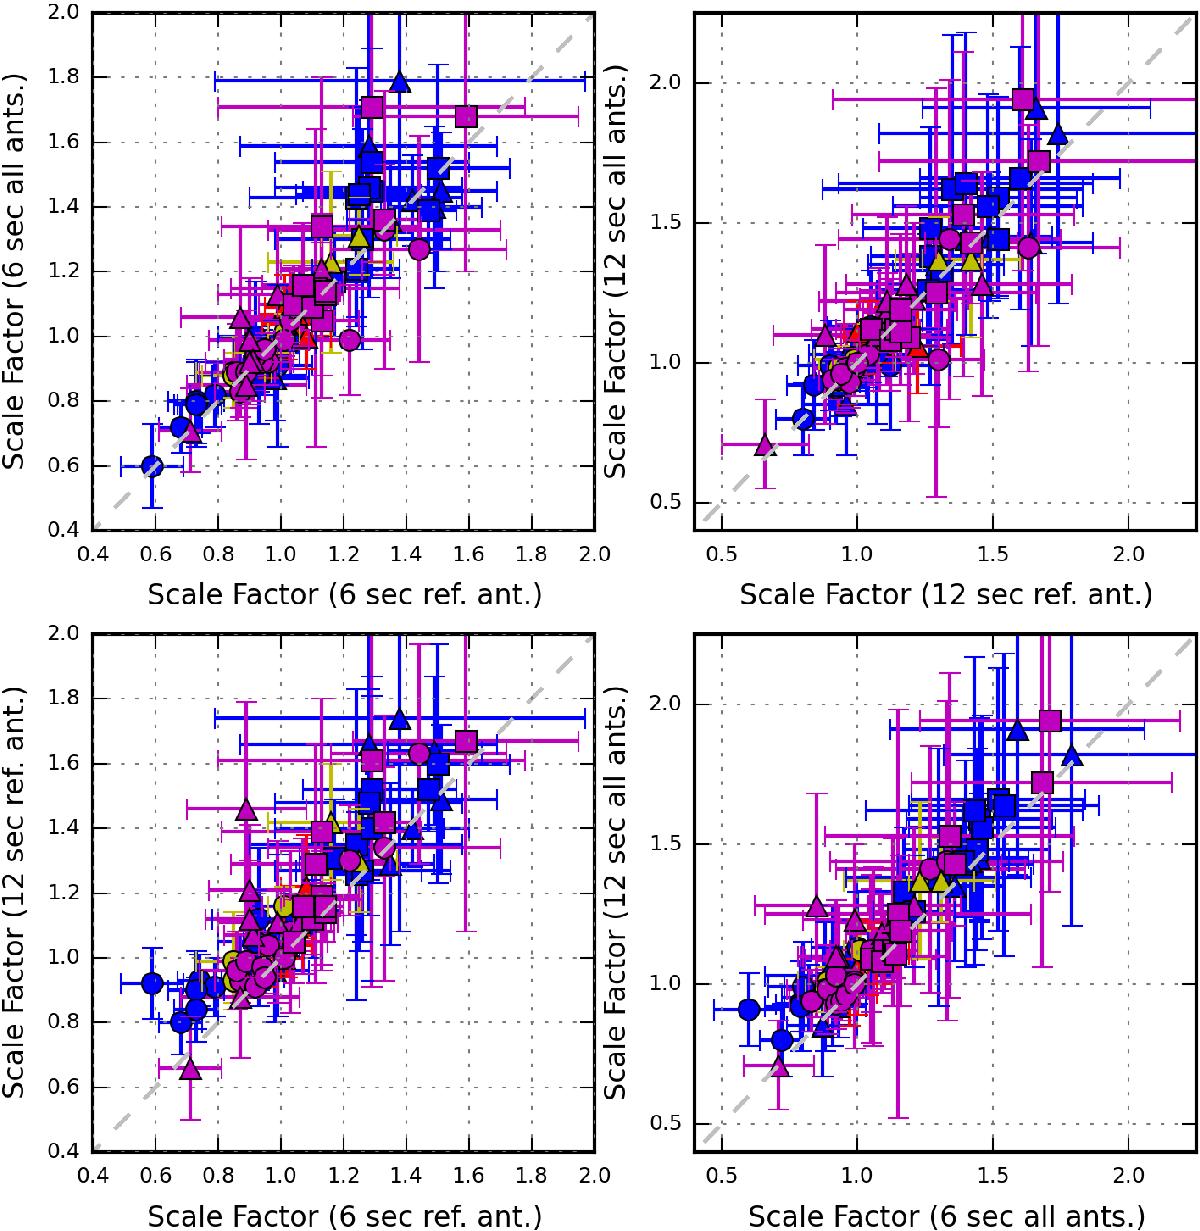
Various comparisons of the scaling factors at the 6 and 12 s timescales as calculated for baselines made with the reference antenna only and those using all baselines in the array. The top panels show that for both the 6 (left) and 12 (right) second timescales the scaling factors calculated over baselines with the reference antenna and all antennas are coincident given the uncertainties in the scaling factors themselves and follow the 1:1 line (grey dashed). In the bottom panel comparing 6 and 12 s scaling factors for baselines with the reference antenna (left) and those from all baselines (right) shows that the 12 s factors are either ~equal to those at 6 s or very slightly larger. Within uncertainties the scaling factors from the various calculations are typically in reasonable agreement. The colours represent the different sources, HL Tau in blue, Juno in red, Mira in yellow, SDP.81 in purple, while the symbols represent the different observing bands, band 3 or 4 are circles, band 6 are triangles and band 7 are squares.
Current usage metrics show cumulative count of Article Views (full-text article views including HTML views, PDF and ePub downloads, according to the available data) and Abstracts Views on Vision4Press platform.
Data correspond to usage on the plateform after 2015. The current usage metrics is available 48-96 hours after online publication and is updated daily on week days.
Initial download of the metrics may take a while.