Fig. 3
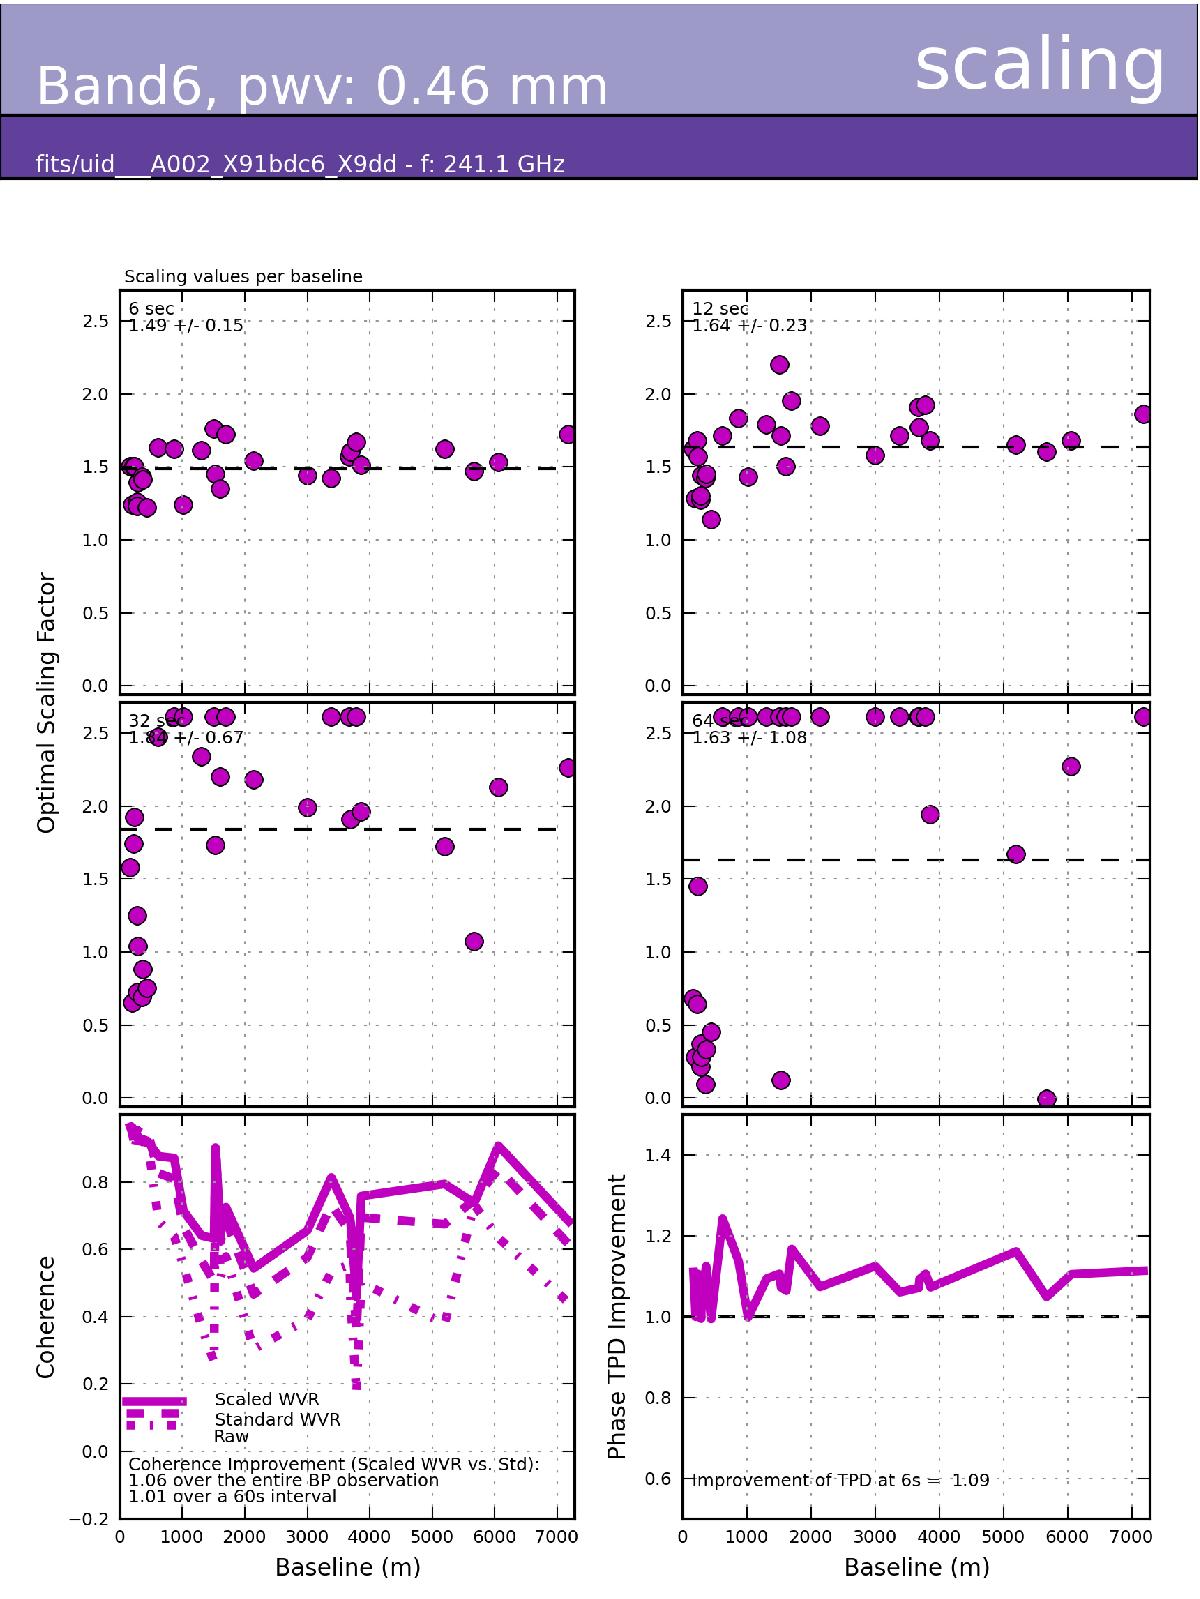
Water vapour radiometer scaling diagnostic plot. The four plots, from left to right, top and middle rows are the optimal scaling factors vs. baseline length made with the reference antenna that minimises the corrected phase after the WVR application, according to the TPD phase statistics measured at 6, 12, 32, and 64 s timescales. The bottom right plot indicates the additional improvement to the phase TPD after applying the average scaling factor derived for the 6 s two-point-deviation φσ(6s), while the left bottom plot indicates the coherence against baseline length for the raw, standard WVR-corrected and scaled WVR-corrected data. The coherence improvement expected over the entire observation of the bandpass (using the phase rms from the full observation) and that expected over only 60 s (related to the on-source time of the science target, using a phase rms over a 60 s interval) are reported. See http://www.alma-allegro.nl/wvr-and-phase-metrics/wvr-scaling for an example of all baselines plots.
Current usage metrics show cumulative count of Article Views (full-text article views including HTML views, PDF and ePub downloads, according to the available data) and Abstracts Views on Vision4Press platform.
Data correspond to usage on the plateform after 2015. The current usage metrics is available 48-96 hours after online publication and is updated daily on week days.
Initial download of the metrics may take a while.