Fig. 2
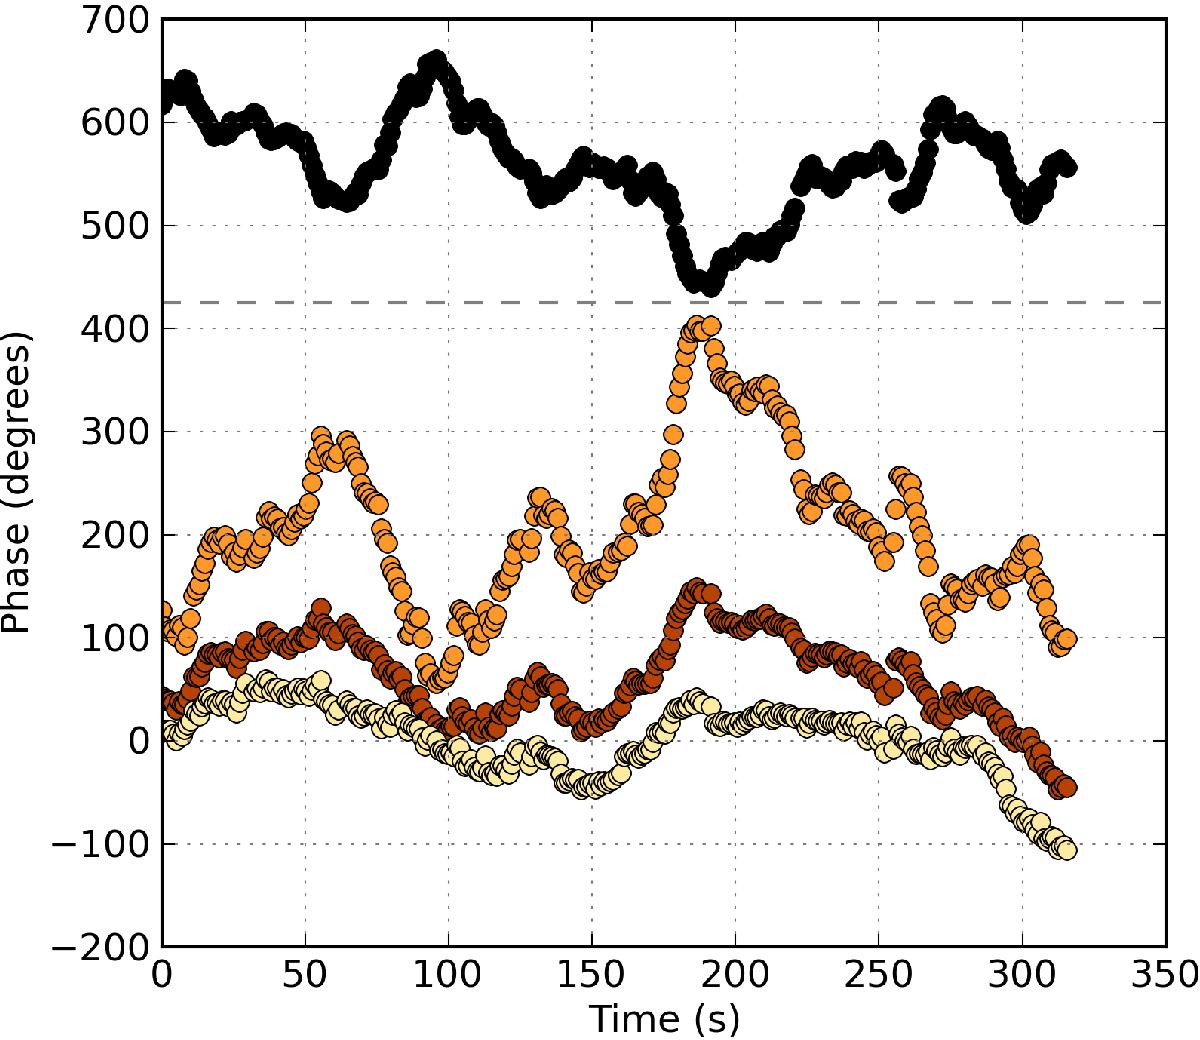
Differential phase streams (degrees) for a ~5500 m baseline made between two antennas, DA51 and DV13, from EB X760. The orange symbols represent the raw phases as measured, the red symbols are the phases after the standard application of the WVR correction (unity scale), and the yellow symbols are the corrected phases after applying a scaling to the WVR solution, in this case the optimal factor 1.42 (Table B.1). The black symbols indicate the baseline-based WVR solution, which in the ideal case should exactly mirror the raw phase if only water vapour fluctuations (as measured by the WVRs) cause the phase delays in the raw phase. It is clear to see the amplitude of the phase fluctuations in the WVR solution (black) is less than those in the raw data (orange), thus leaving room for improvement via a WVR scaling factor.
Current usage metrics show cumulative count of Article Views (full-text article views including HTML views, PDF and ePub downloads, according to the available data) and Abstracts Views on Vision4Press platform.
Data correspond to usage on the plateform after 2015. The current usage metrics is available 48-96 hours after online publication and is updated daily on week days.
Initial download of the metrics may take a while.