Fig. 11
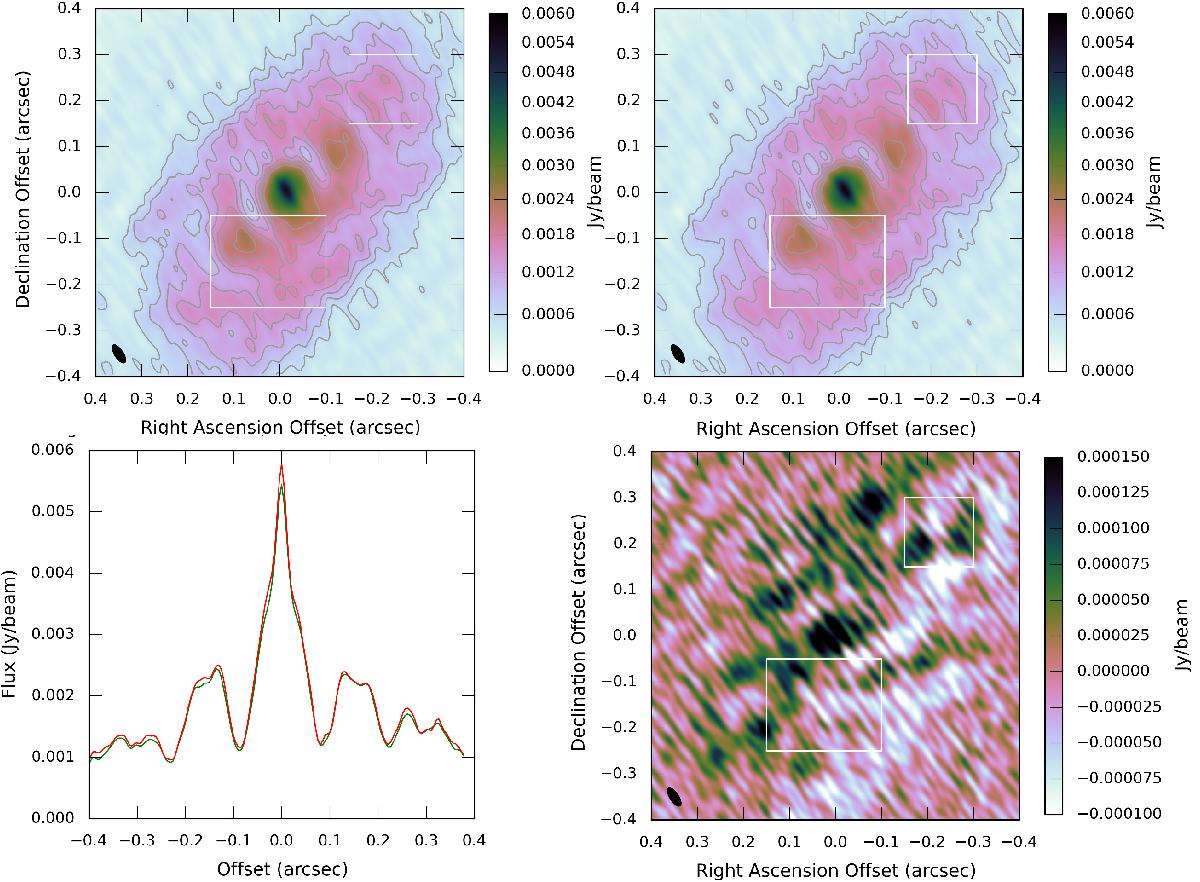
Comparisons of HL Tau images from the EB X760. The top left and top right represent the images made with the standard WVR and scaled WVR solutions applied. The colour scales for both are fixed to a peak value of 6.0 mJy/bm, where the peak fluxes are 5.5 and 5.9 mJy/beam for the images with the standard and scaled WVR applications. The bottom right indicates the difference image (scaled − standard), while a profile is shown in the bottom left (red indicates the WVR scaled image). The profile is extracted along a line from ~(0.3, −0.3) to ~(−0.3, 0.3). The boxes on the plots highlight regions to the NW and SE as discussed in the text.
Current usage metrics show cumulative count of Article Views (full-text article views including HTML views, PDF and ePub downloads, according to the available data) and Abstracts Views on Vision4Press platform.
Data correspond to usage on the plateform after 2015. The current usage metrics is available 48-96 hours after online publication and is updated daily on week days.
Initial download of the metrics may take a while.