Fig. 1
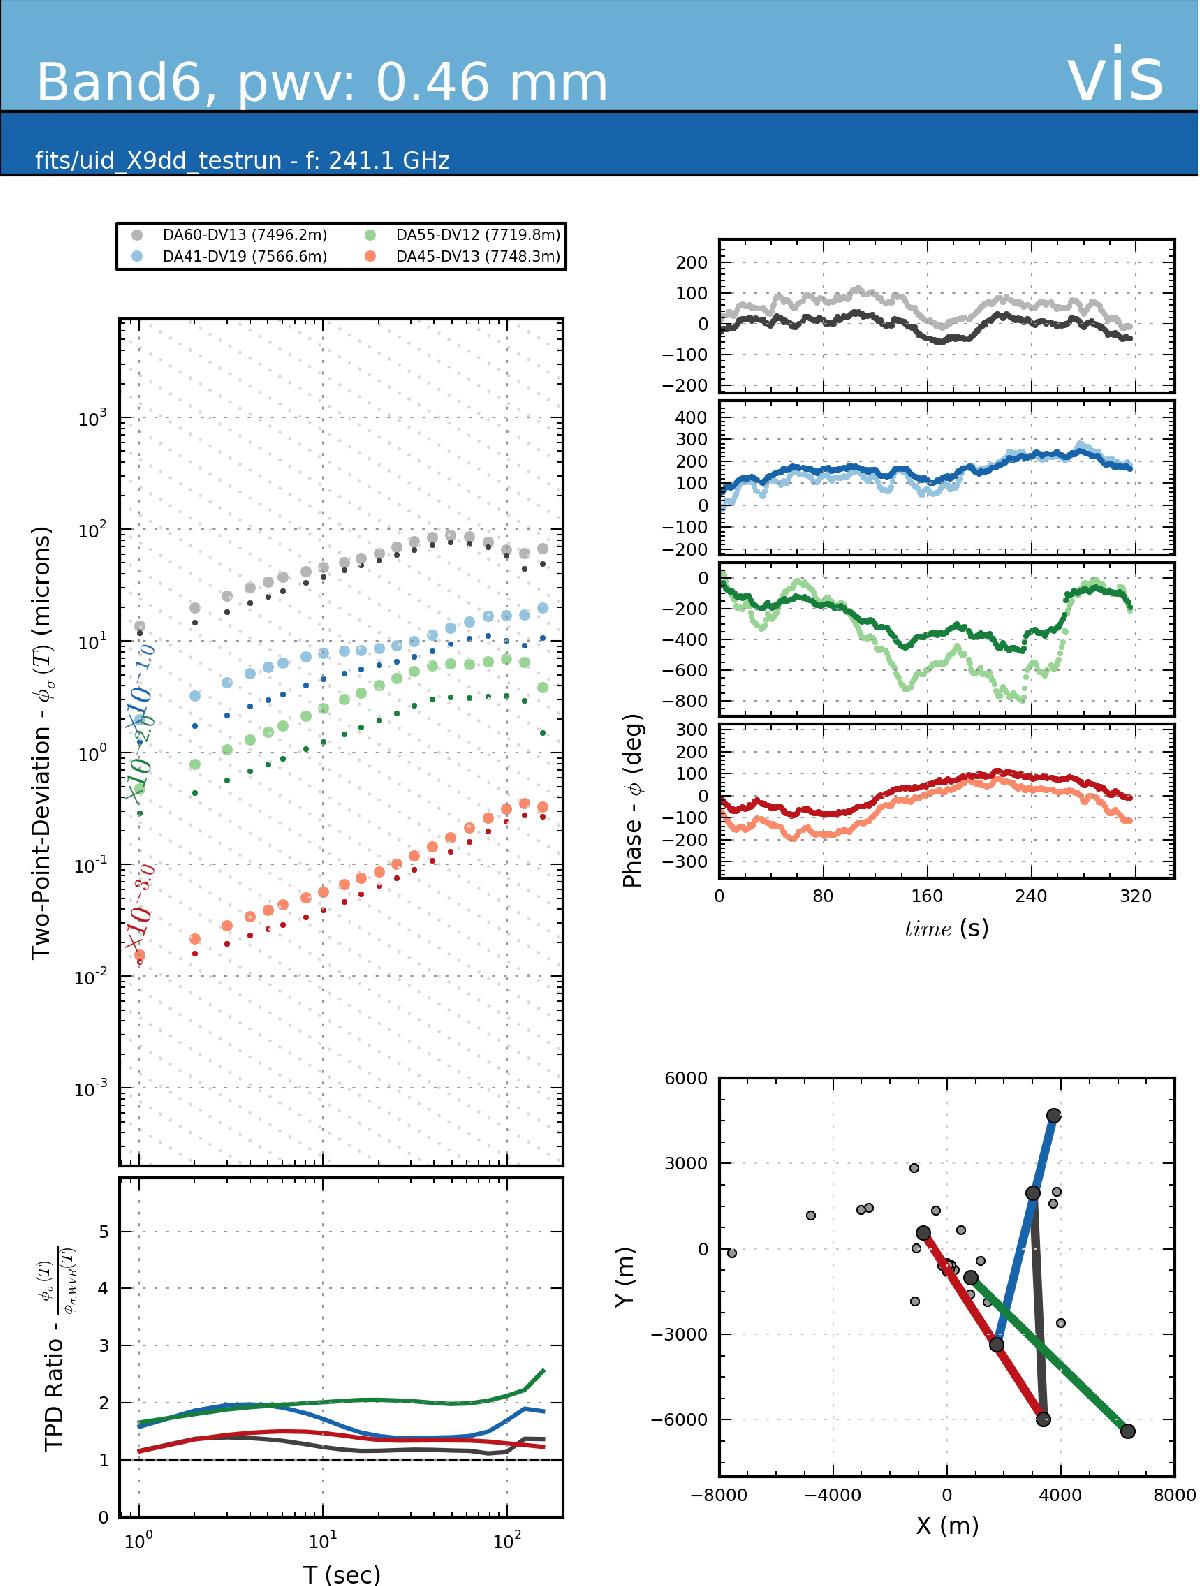
One of the diagnostic output plots from the scripts reading in the datasets and unwrapping the phase streams. A key for the baselines and information about the dataset are shown on the top left. The top left plot shows the two-point-deviations for the raw and corrected phases in micrometres (light and dark points, respectively; each baseline is scaled by an order of magnitude for clarity). The bottom left plot shows the ratio of improvement due to applying the WVR correction in a standard manner; for these band 7 data the average is <2. The top right plot shows the raw and WVR-corrected phase streams (light and dark) while the bottom right plot shows the positions of the antennas and associated baselines used. In the phase stream plots (top right) the scale of baseline DA55−DV12 is larger and the two-point deviations are also very elevated almost by an order of magnitude. This points to a possible issue with DA55.
Current usage metrics show cumulative count of Article Views (full-text article views including HTML views, PDF and ePub downloads, according to the available data) and Abstracts Views on Vision4Press platform.
Data correspond to usage on the plateform after 2015. The current usage metrics is available 48-96 hours after online publication and is updated daily on week days.
Initial download of the metrics may take a while.