Fig. 7
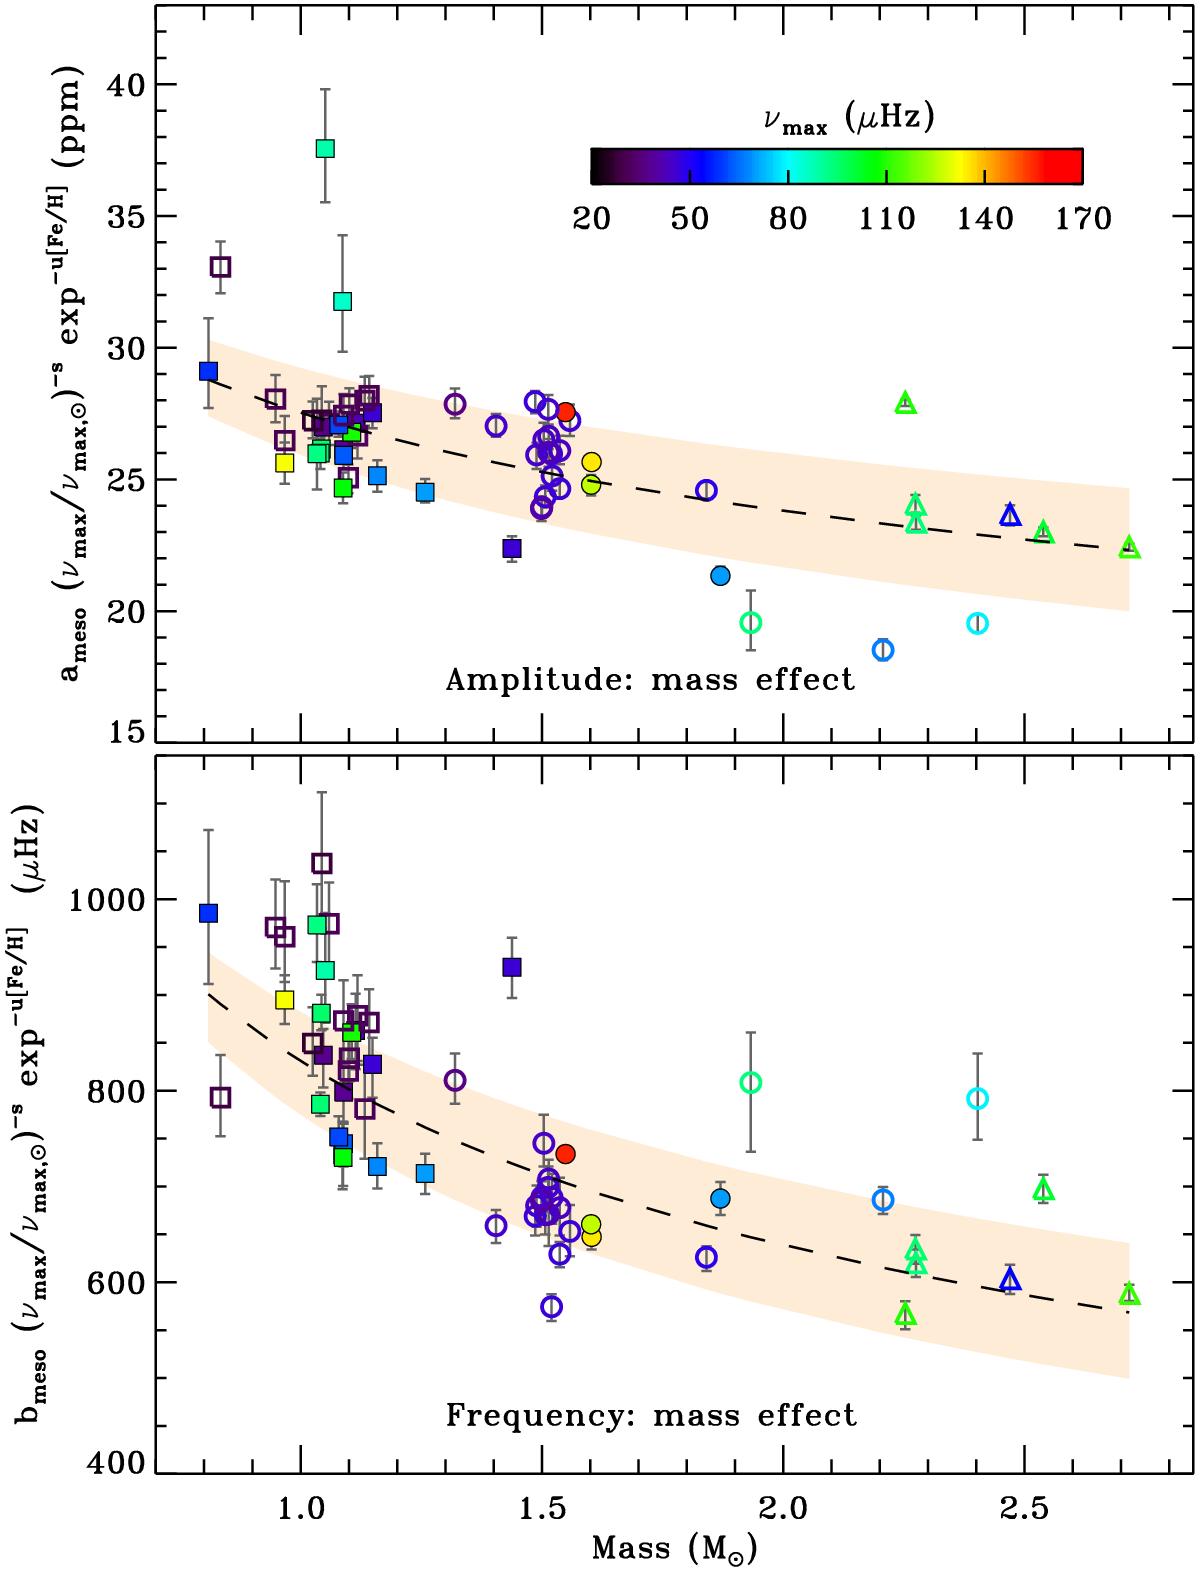
Amplitudes (top panel) and frequencies (bottom panel) of the meso-granulation component for the 60 cluster RGs, as a function of the corrected stellar masses from Sect. 2.4. Dependencies upon νmax and [Fe/H] were removed by means of the best scaling relations identified in Sect. 5.1 (Eq. (7) for the top panel and Eq. (10) for the bottom panel). The dashed lines mark the fits from the best scaling relations, while the shaded regions delimit the 1σ credible regions from the estimated parameters (Table 2). Open symbols denote RC stars, while filled symbols are RGB stars, with cluster membership indicated by the same symbol types as in Fig. 3. The values of νmax are color-coded for each star. Rescaled Bayesian credible intervals of 68.3% for each meso-granulation parameter are overlaid on both panels.
Current usage metrics show cumulative count of Article Views (full-text article views including HTML views, PDF and ePub downloads, according to the available data) and Abstracts Views on Vision4Press platform.
Data correspond to usage on the plateform after 2015. The current usage metrics is available 48-96 hours after online publication and is updated daily on week days.
Initial download of the metrics may take a while.