Fig. 5
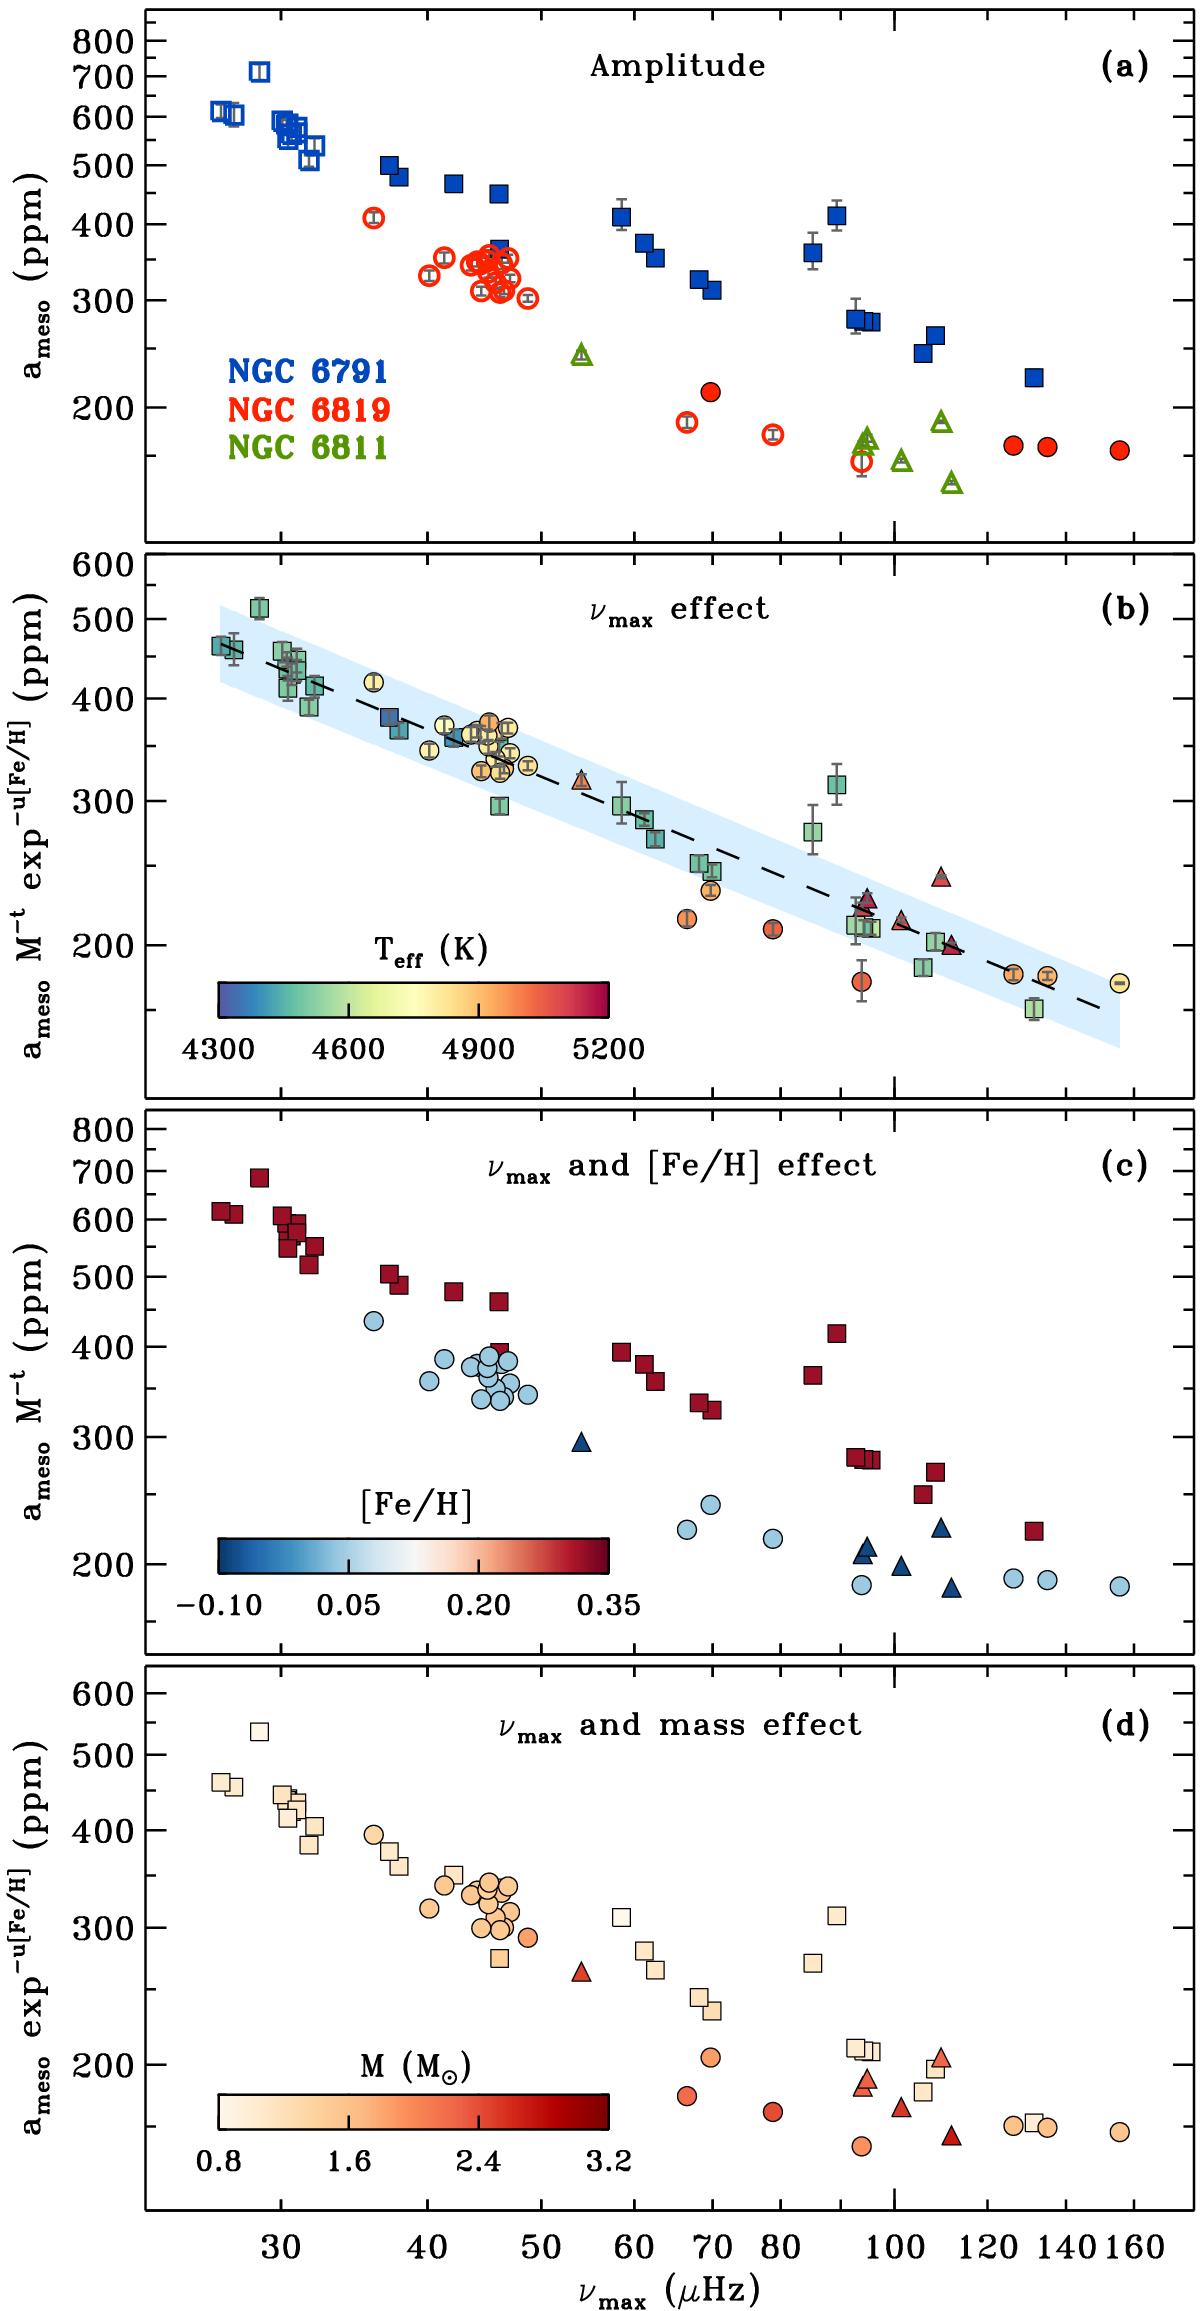
Amplitude of the meso-granulation component as a function of νmax for the 60 cluster RGs. Color-coding in panel a shows the cluster membership, with open symbols for RC and filled ones for RGB stars, and the symbol types indicating the cluster membership as in Fig. 3. Panel b shows the amplitudes after removing the effect of both mass and metallicity using the best scaling relation identified in Sect. 6 (model ℳa,2), with the resulting fit marked by a dashed line and corresponding 1σ credible region in shading, and with Teff from the SDSS-based temperature scale color-coded for each star. Panels c and d show the amplitudes after removing the effect of only mass and only metallicity, respectively, where cluster mean metallicities from ASPCAP and corrected masses of the stars from Sect. 2.4 are color-coded. Bayesian credible intervals of 68.3% on meso-granulation amplitudes are shown in panel a, and are rescaled in panel b.
Current usage metrics show cumulative count of Article Views (full-text article views including HTML views, PDF and ePub downloads, according to the available data) and Abstracts Views on Vision4Press platform.
Data correspond to usage on the plateform after 2015. The current usage metrics is available 48-96 hours after online publication and is updated daily on week days.
Initial download of the metrics may take a while.