Fig. C.1
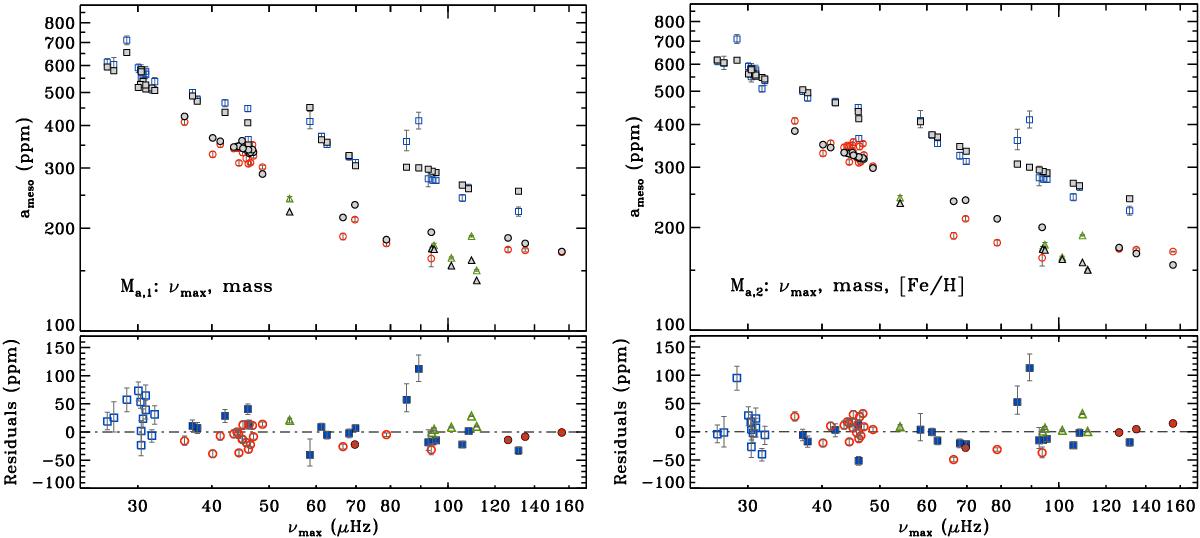
Top panels: predicted meso-granulation amplitudes (solid gray symbols) as a function of νmax for NGC 6791 (squares), NGC 6819 (circles) and NGC 6811 (triangles). Median values of the free parameters have been adopted for each scaling relation, as reported in Table 2. Observed meso-granulation amplitudes are shown in color with open symbols. The left plot shows the results for the model ℳa,1, while the right one uses model ℳa,2. Bottom panels: the residuals computed as (Observed-Predicted) meso-granulation amplitudes, with same color and symbol type as in Fig. 5a. Bayesian credible intervals of 68.3% are overlaid in both panels.
Current usage metrics show cumulative count of Article Views (full-text article views including HTML views, PDF and ePub downloads, according to the available data) and Abstracts Views on Vision4Press platform.
Data correspond to usage on the plateform after 2015. The current usage metrics is available 48-96 hours after online publication and is updated daily on week days.
Initial download of the metrics may take a while.