Free Access
Fig. 3
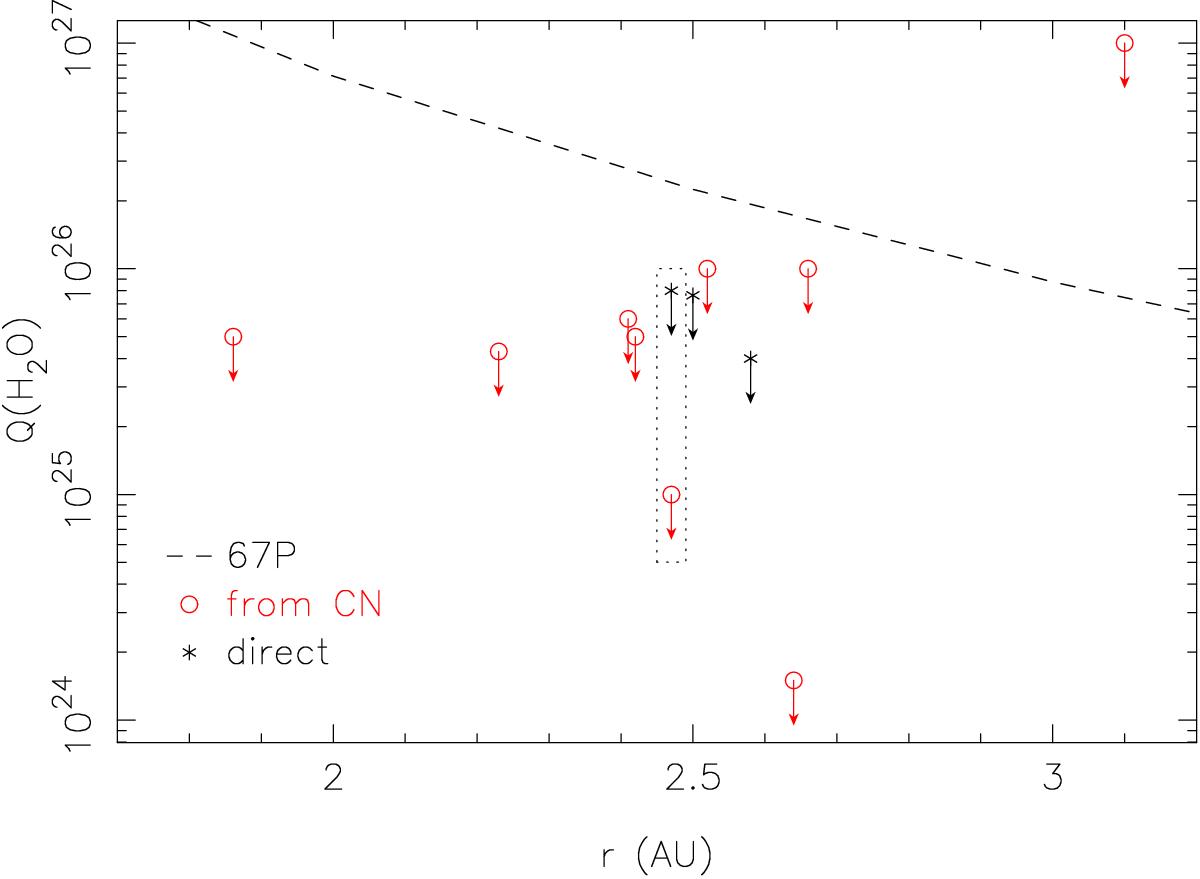
Upper limits on water production, via CN or direct (H2O or OH). Water production rate for 67P, as a typical JFC, shown by dashed line for comparison (empirical fit to inbound data – Hansen et al. 2016). Our X-shooter results are highlighted by the dotted box.
Current usage metrics show cumulative count of Article Views (full-text article views including HTML views, PDF and ePub downloads, according to the available data) and Abstracts Views on Vision4Press platform.
Data correspond to usage on the plateform after 2015. The current usage metrics is available 48-96 hours after online publication and is updated daily on week days.
Initial download of the metrics may take a while.