Fig. 2
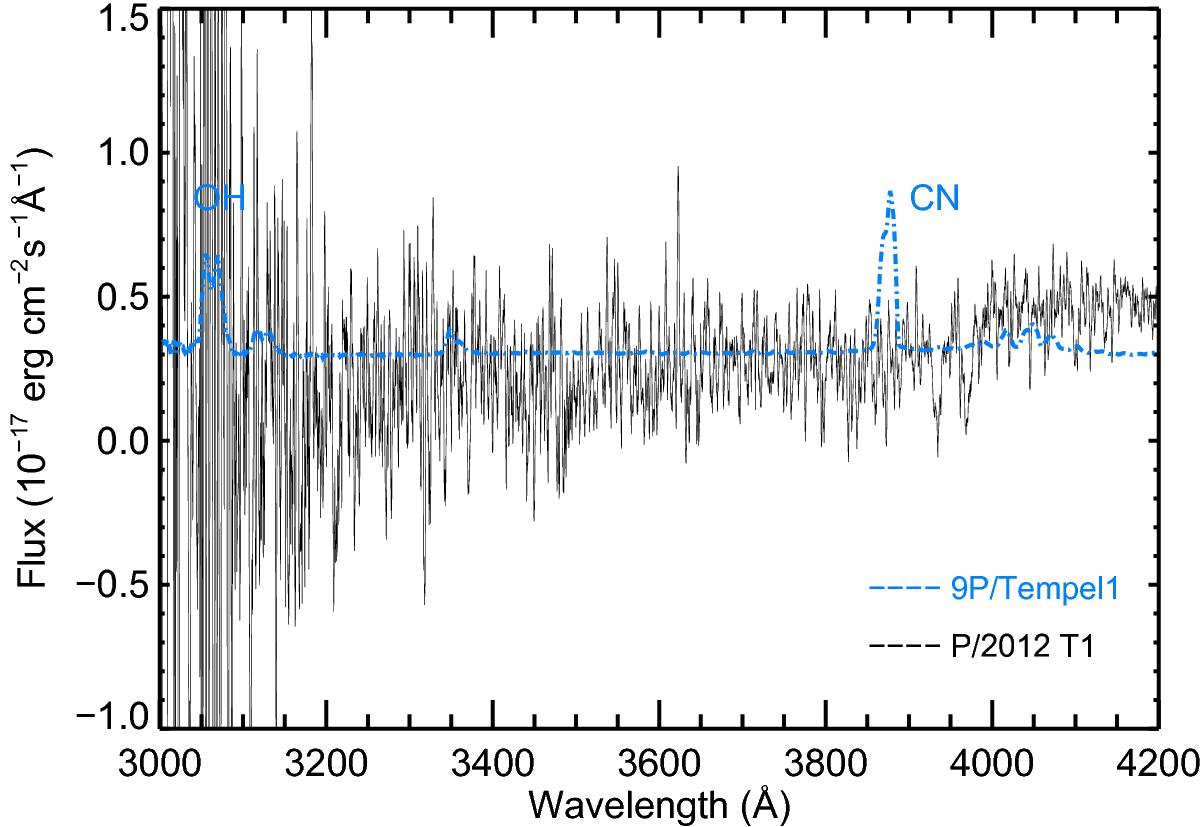
Combined flux spectrum of P/2012 T1 (without any solar spectrum removal), zoomed in on the UV region around the expected OH and CN emission bands, which has been smoothed over 20 adjacent points (about 3.7 Å). A rescaled and offset spectrum of 9P/Tempel 1, obtained by Meech et al. (2011), is overlaid to illustrate the locations of the OH(0-0) and CN(0-0) emission bands.
Current usage metrics show cumulative count of Article Views (full-text article views including HTML views, PDF and ePub downloads, according to the available data) and Abstracts Views on Vision4Press platform.
Data correspond to usage on the plateform after 2015. The current usage metrics is available 48-96 hours after online publication and is updated daily on week days.
Initial download of the metrics may take a while.