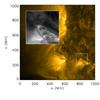
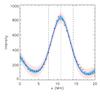
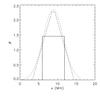
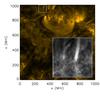
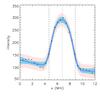
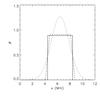
Fig. 1
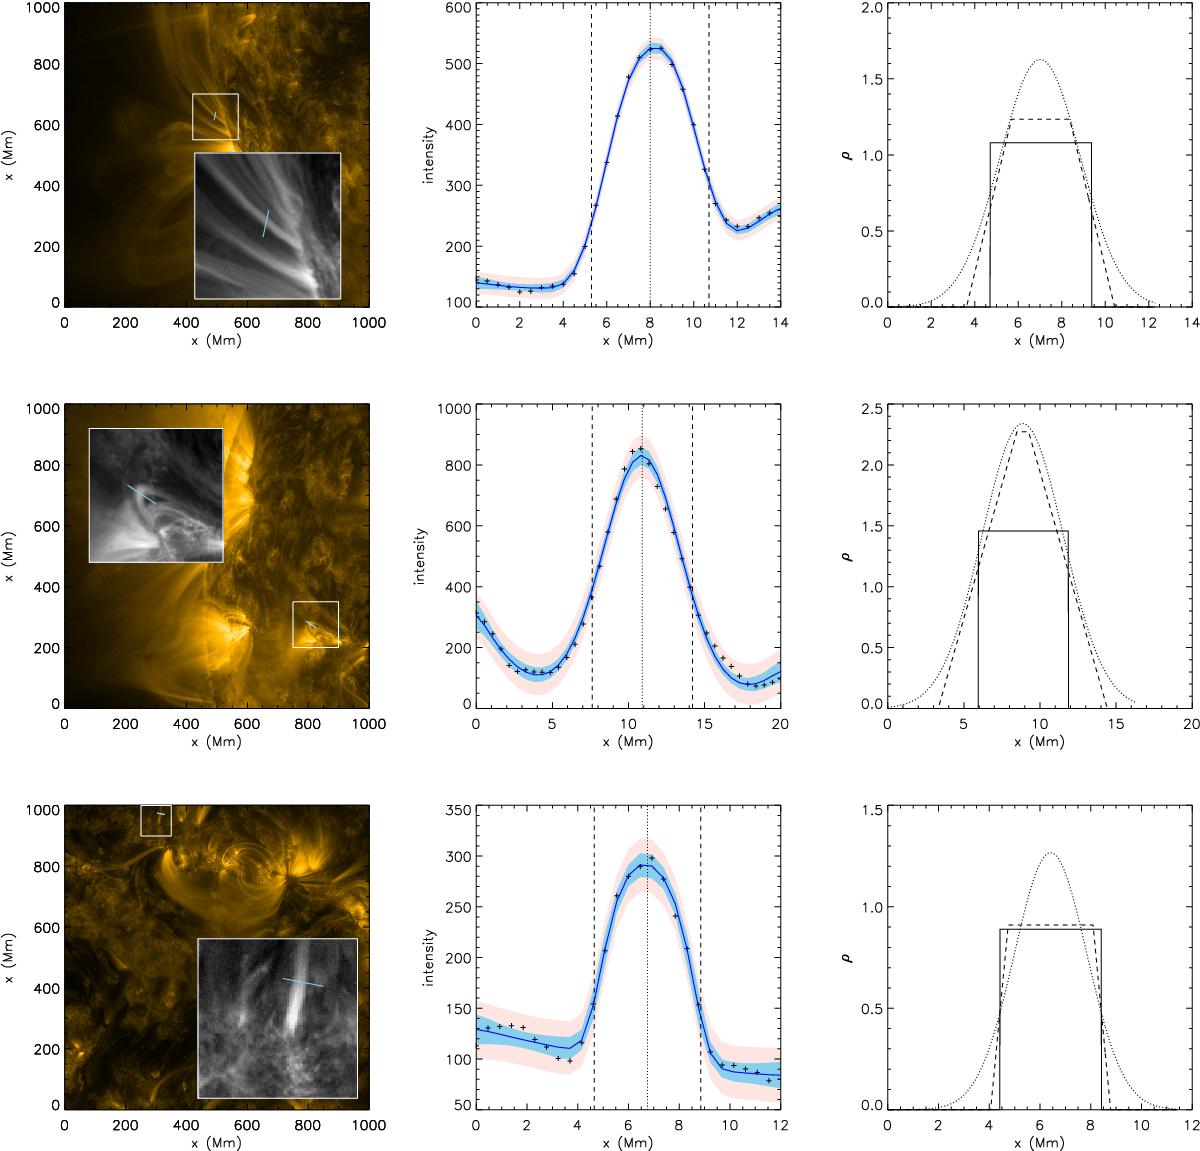
Examples of loops for which models L (top), G (middle), and S (bottom) were found to best describe the data. Left: SDO/AIA 171 Å image of an analysed loop. The blue lines indicates the location of the slits used to generate the transverse intensity profiles. The white box and inset show a magnified region around the loop. Middle: 171 Å EUV intensity profile (symbols) across the selected loop. Model L (blue line) is plotted, with the model values being the median values from the corresponding probability distributions. The shaded areas represent the 99% confidence region for the intensity predicted by the model, with (red) and without (blue) modelled noise.The vertical dotted and dashed lines denote x0 and x0 ± R, respectively. Right: returned density profiles for models S (solid), L (dashed) and G (dotted).
Current usage metrics show cumulative count of Article Views (full-text article views including HTML views, PDF and ePub downloads, according to the available data) and Abstracts Views on Vision4Press platform.
Data correspond to usage on the plateform after 2015. The current usage metrics is available 48-96 hours after online publication and is updated daily on week days.
Initial download of the metrics may take a while.