Fig. 7
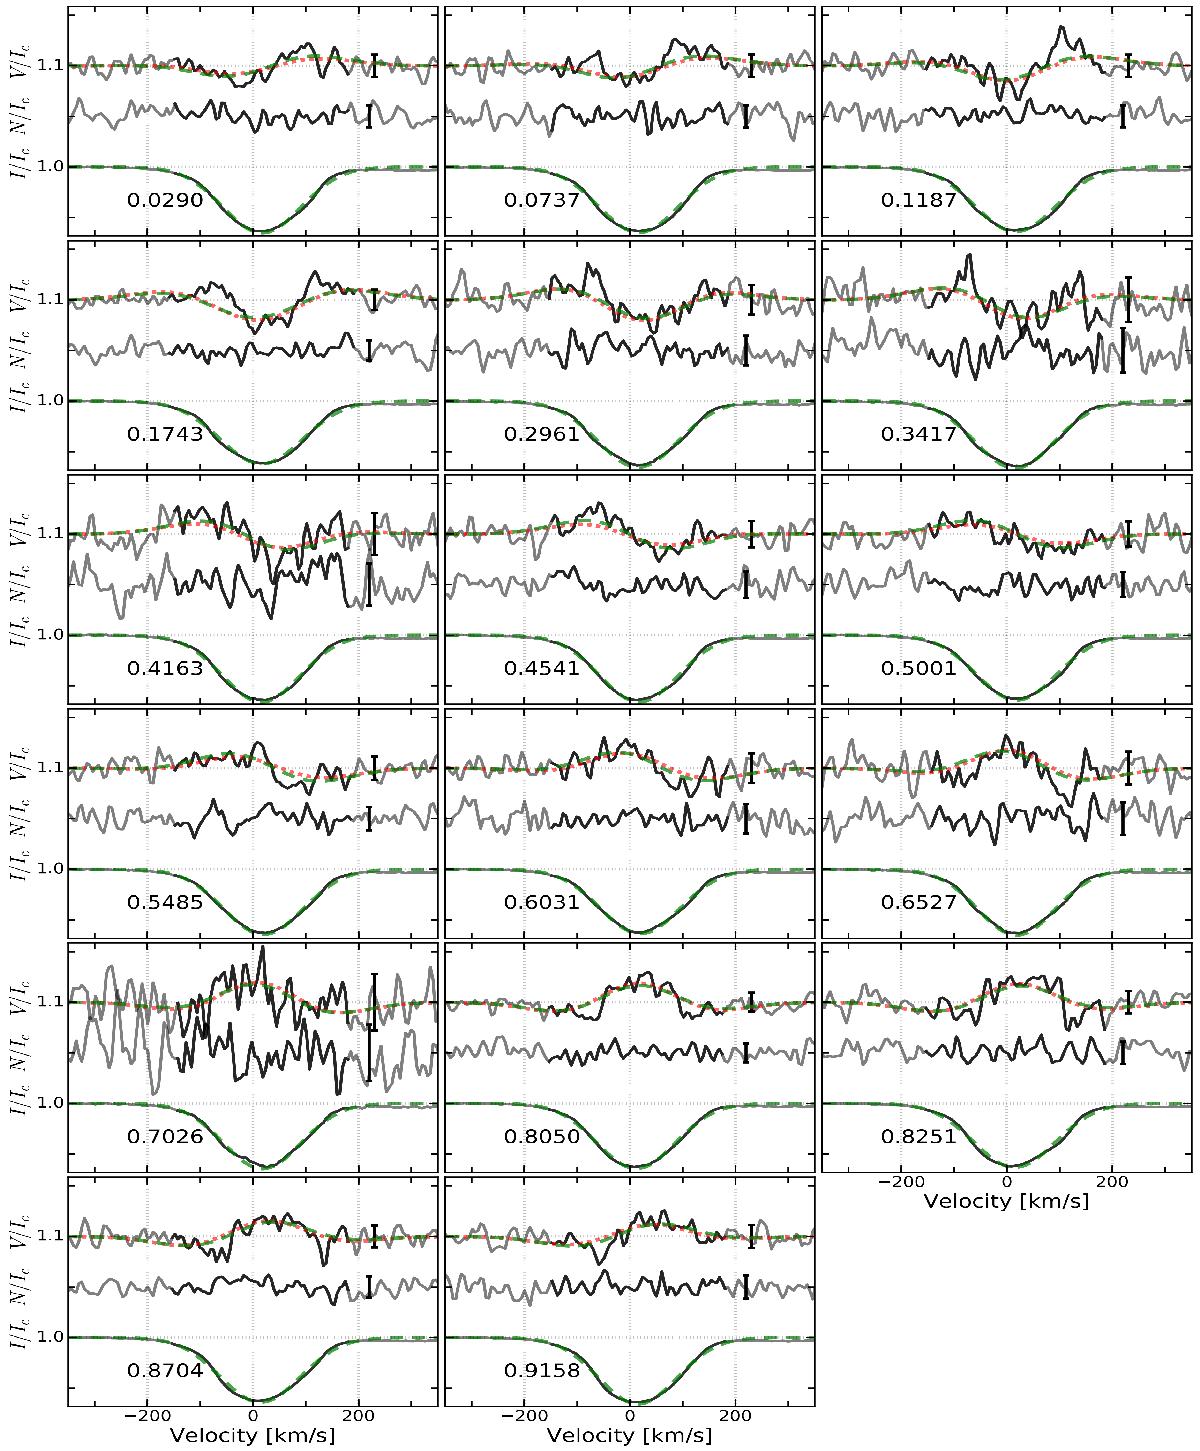
Observed LSD profiles compared with the results from the Stokes V modeling. Panels are organized according to the rotation phase and contain the observed intensity profile (I/Ic; bottom), the Null profile (N/Ic; middle), and the Stokes V (V/Ic; top) profiles given in black. Both the Null and Stokes V profiles are multiplied by a factor 100 and smoothed with a Gaussian filter with a width of 6 km s-1 for increased visibility. Their respective error bars are indicated on the right side of each panel. The centered dipole model of Sect. 5.1 is indicated by the green dashed lines, while that of Sect. 5.2 by the red dotted lines.
Current usage metrics show cumulative count of Article Views (full-text article views including HTML views, PDF and ePub downloads, according to the available data) and Abstracts Views on Vision4Press platform.
Data correspond to usage on the plateform after 2015. The current usage metrics is available 48-96 hours after online publication and is updated daily on week days.
Initial download of the metrics may take a while.