Fig. 6
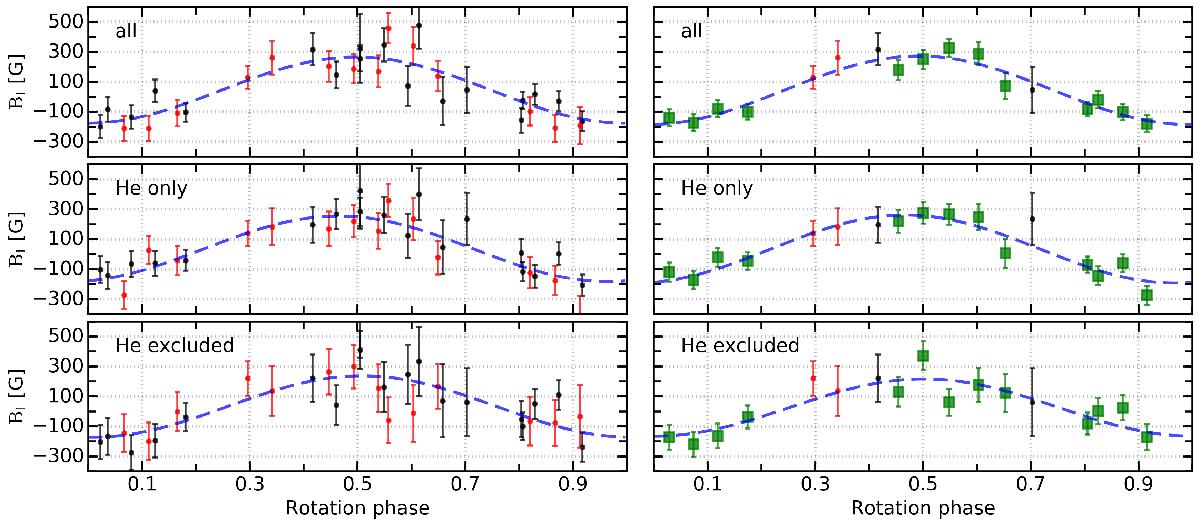
Longitudinal field measurements for HD 43317 for various LSD linemasks. Left: deduced values from the individual Narval spectropolarimetric sequences. The archival spectropolarimetry (B13) is indicated in black, while the additional data presented here are indicated in red. The optimal LS minimization fit, representing the rotational modulation of a dipolar field, is given by the dashed blue line. We assumed Prot = 0.897673 d and T0 = 2 456 185.8380 d. Right: using the phase-binned data, indicated by the green squares.
Current usage metrics show cumulative count of Article Views (full-text article views including HTML views, PDF and ePub downloads, according to the available data) and Abstracts Views on Vision4Press platform.
Data correspond to usage on the plateform after 2015. The current usage metrics is available 48-96 hours after online publication and is updated daily on week days.
Initial download of the metrics may take a while.