Fig. 5
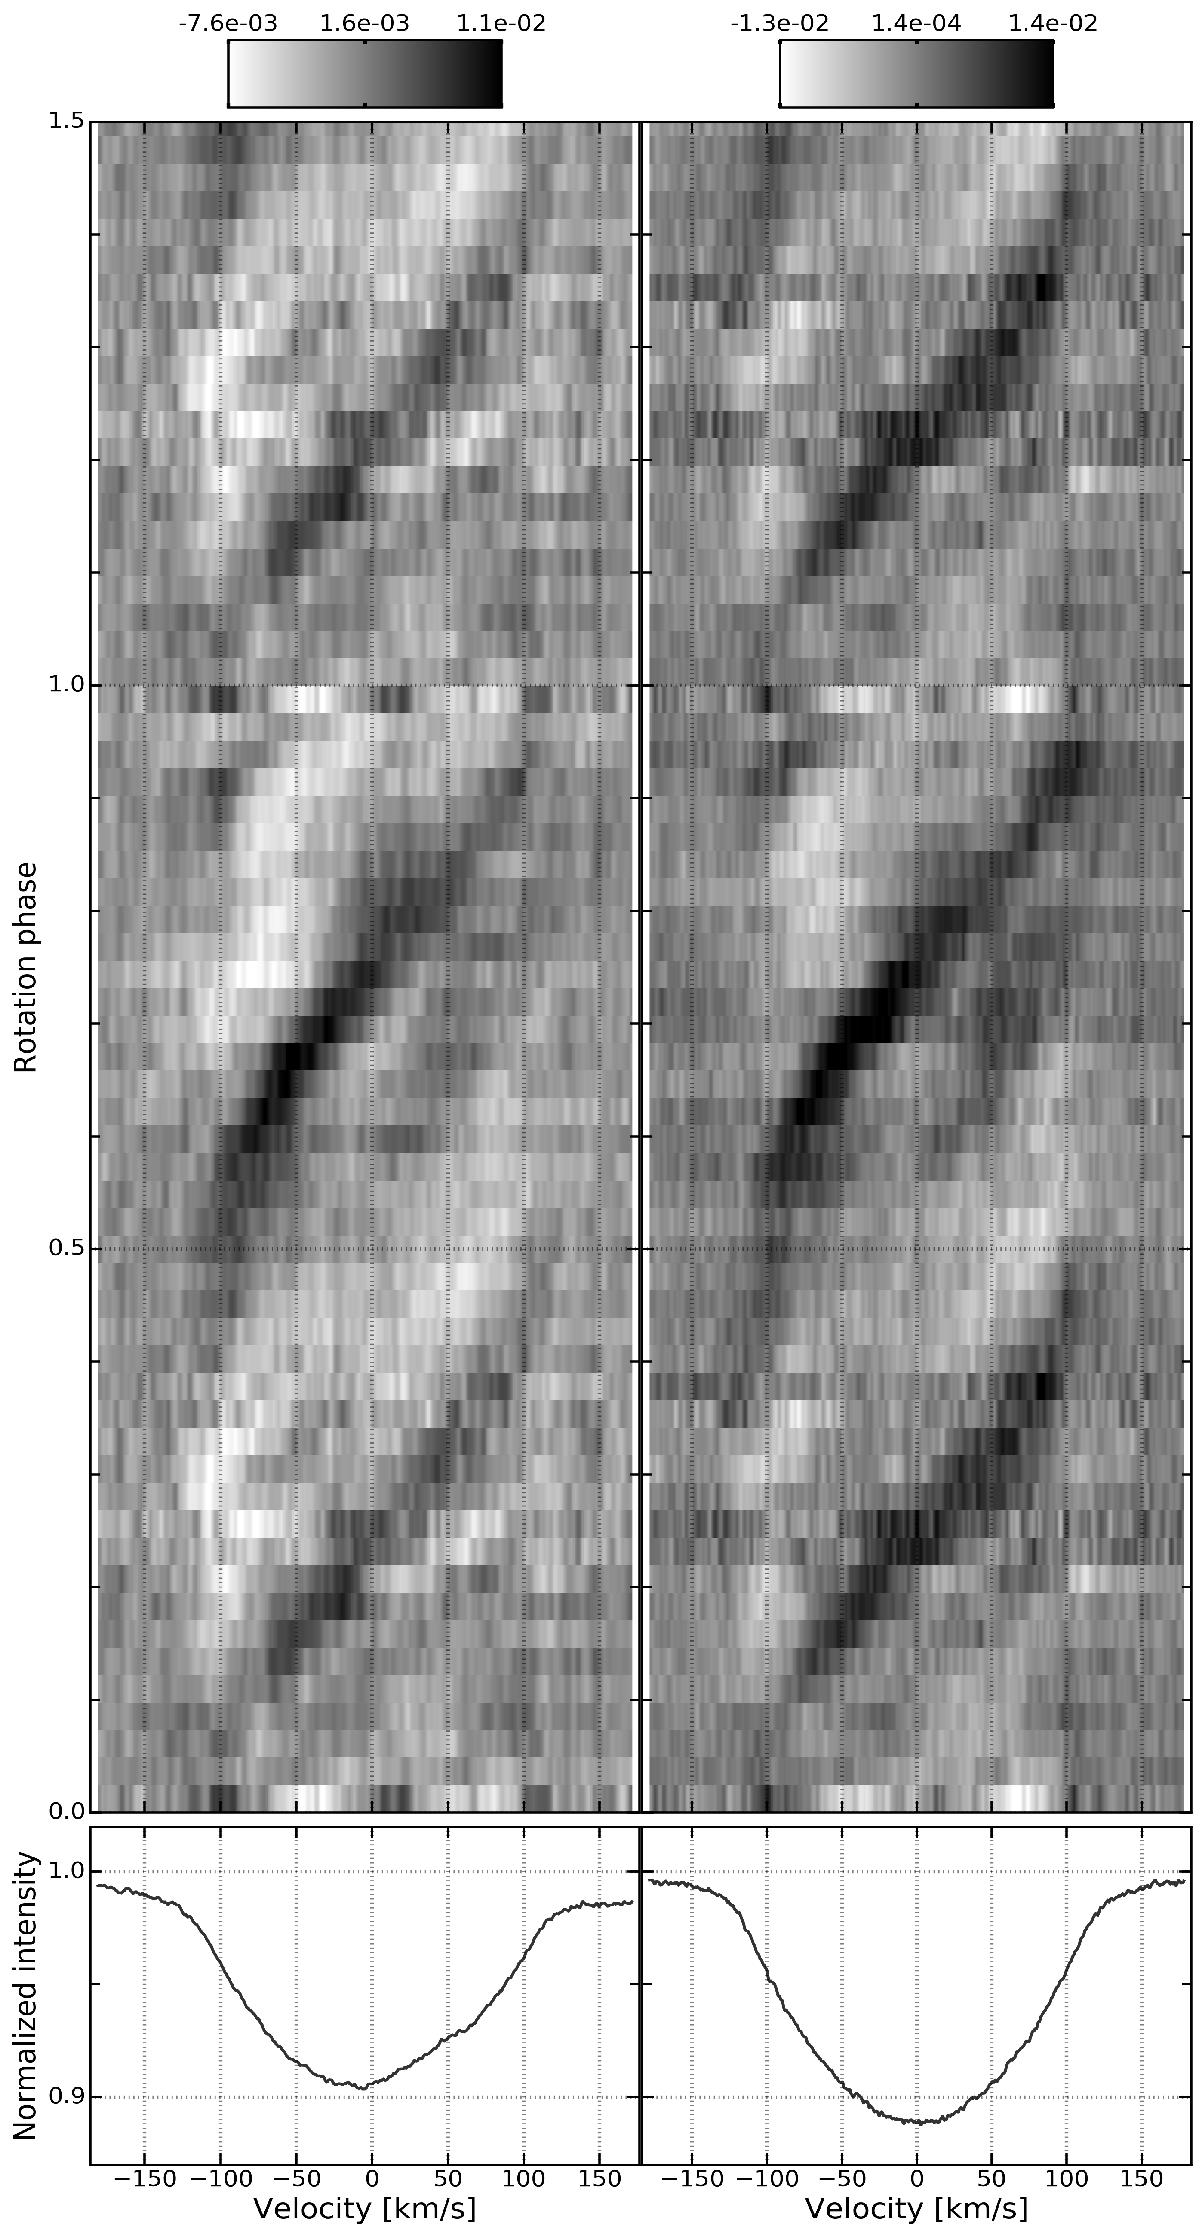
Top: dynamical spectra of the residual He i 5016 Å (left) and He i 6678 Å (right) lines to their respective median profile, phase folded with the rotation period Prot = 0.897673 d and T0 = 2 456 185.8380 d, and smoothed slightly with a Gaussian filter for increased visibility. The variability corresponds to at least two co-rotating surface inhomogeneities at the stellar surface, causing the rotational modulation. The amplitude of the residuals to the mean profile is indicated by the gray-scale. Bottom: mean line profile of both He i absorption lines.
Current usage metrics show cumulative count of Article Views (full-text article views including HTML views, PDF and ePub downloads, according to the available data) and Abstracts Views on Vision4Press platform.
Data correspond to usage on the plateform after 2015. The current usage metrics is available 48-96 hours after online publication and is updated daily on week days.
Initial download of the metrics may take a while.