Fig. 4
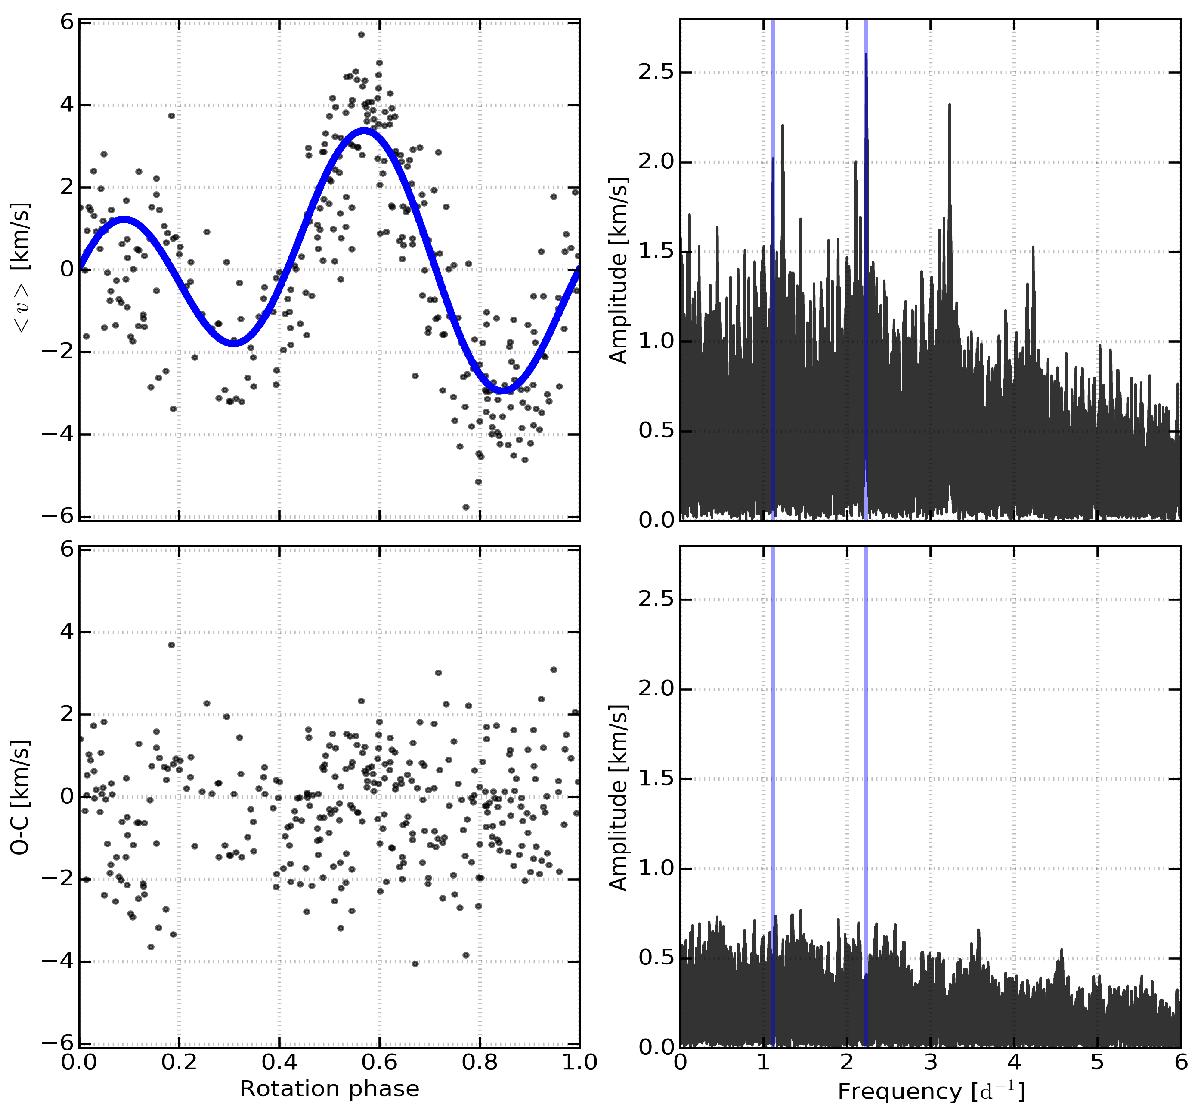
The first moment ⟨ v ⟩ of the He i 6678 Å line from the combined Narval and HARPS spectroscopy (top left). The model for the rotational modulation (see Eq. (1)) for Prot = 0.897673 d and T0 = 2 456 185.8380 d is given as a solid blue line and the observations as black dots. Bottom left: residuals of ⟨ v ⟩ after the subtraction of the model. Right: computed Lomb-Scargle periodograms of ⟨ v ⟩ (top) and the residuals (bottom), with frot and 2frot marked as vertical blue lines.
Current usage metrics show cumulative count of Article Views (full-text article views including HTML views, PDF and ePub downloads, according to the available data) and Abstracts Views on Vision4Press platform.
Data correspond to usage on the plateform after 2015. The current usage metrics is available 48-96 hours after online publication and is updated daily on week days.
Initial download of the metrics may take a while.