Fig. 3
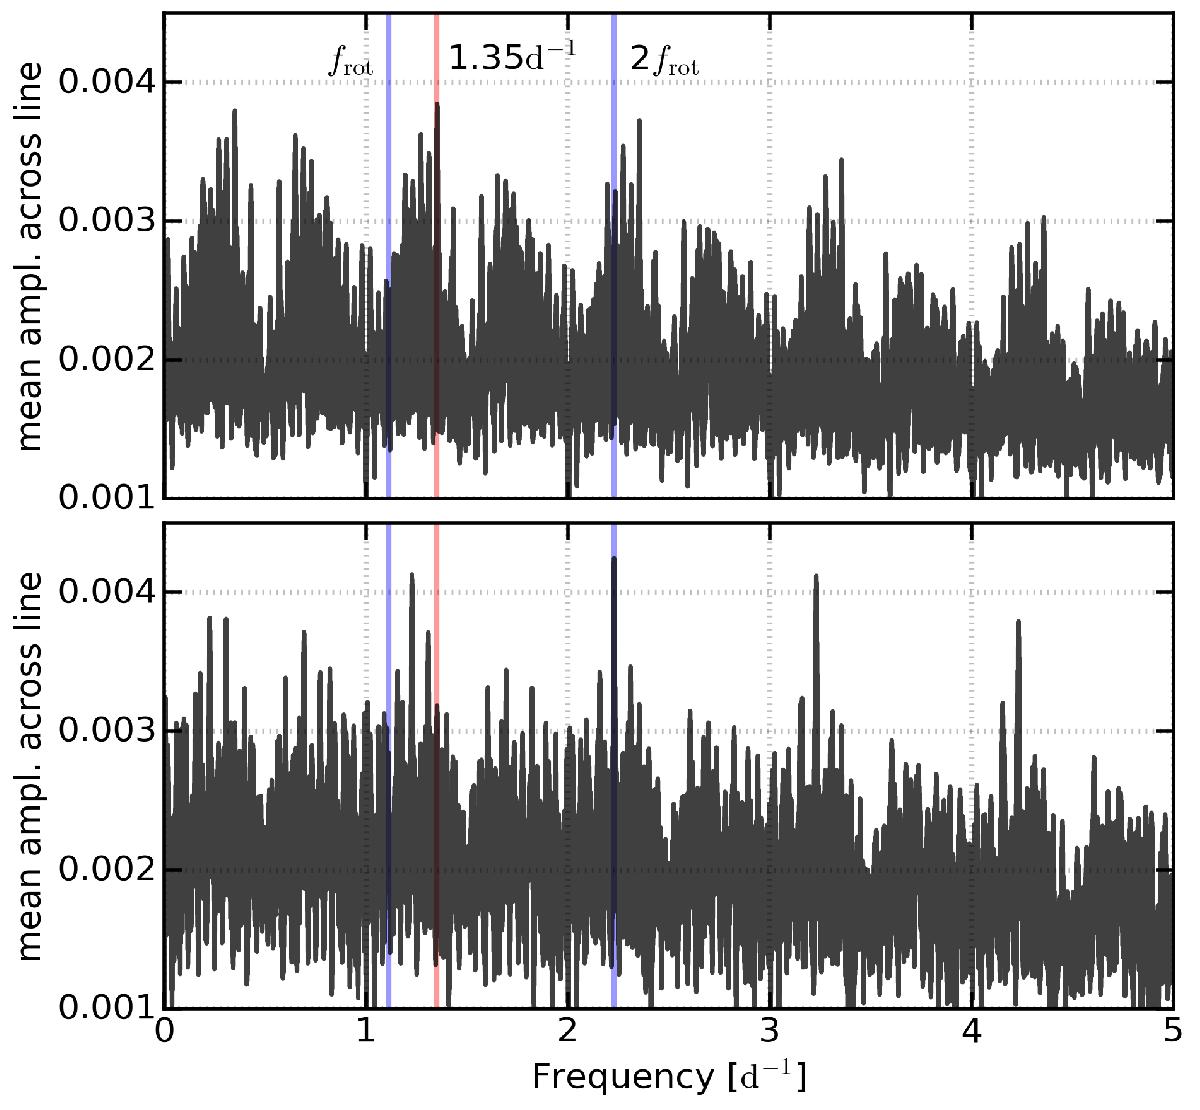
Mean discrete Fourier periodograms over the full line profile variations for the Mg ii 4481 Å (top) and the He i 6678 Å (bottom) absorption lines in the Narval spectroscopy, determined with the pixel-by-pixel method. The rotation frequency and the second harmonic of the rotation frequency are indicated in blue. The found pulsation-mode frequency in the Mg ii line is indicated in red. Strong 1 d-1 aliasing frequency peaks are present in the periodograms.
Current usage metrics show cumulative count of Article Views (full-text article views including HTML views, PDF and ePub downloads, according to the available data) and Abstracts Views on Vision4Press platform.
Data correspond to usage on the plateform after 2015. The current usage metrics is available 48-96 hours after online publication and is updated daily on week days.
Initial download of the metrics may take a while.