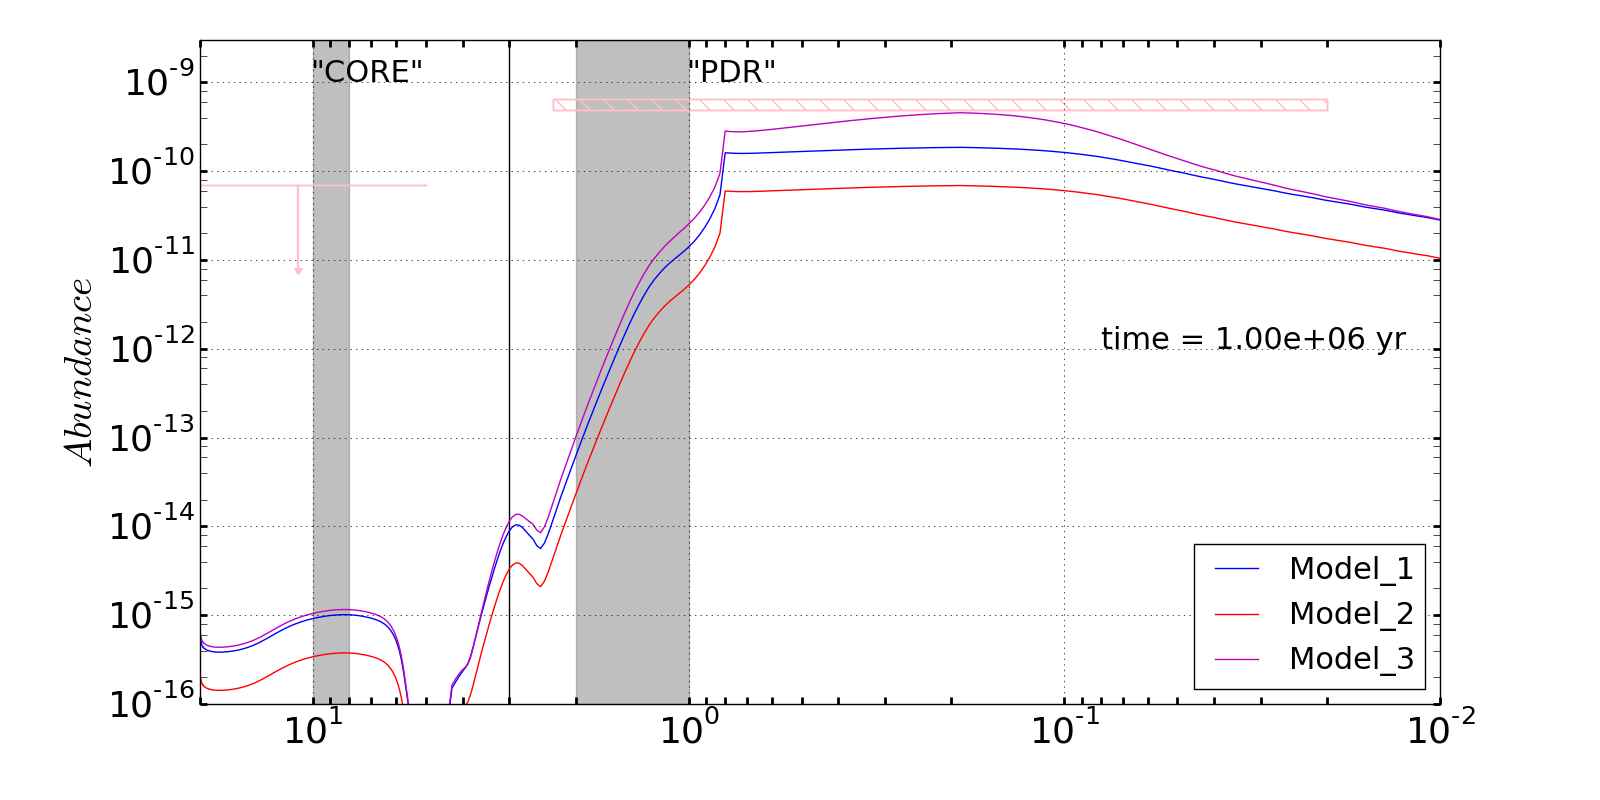
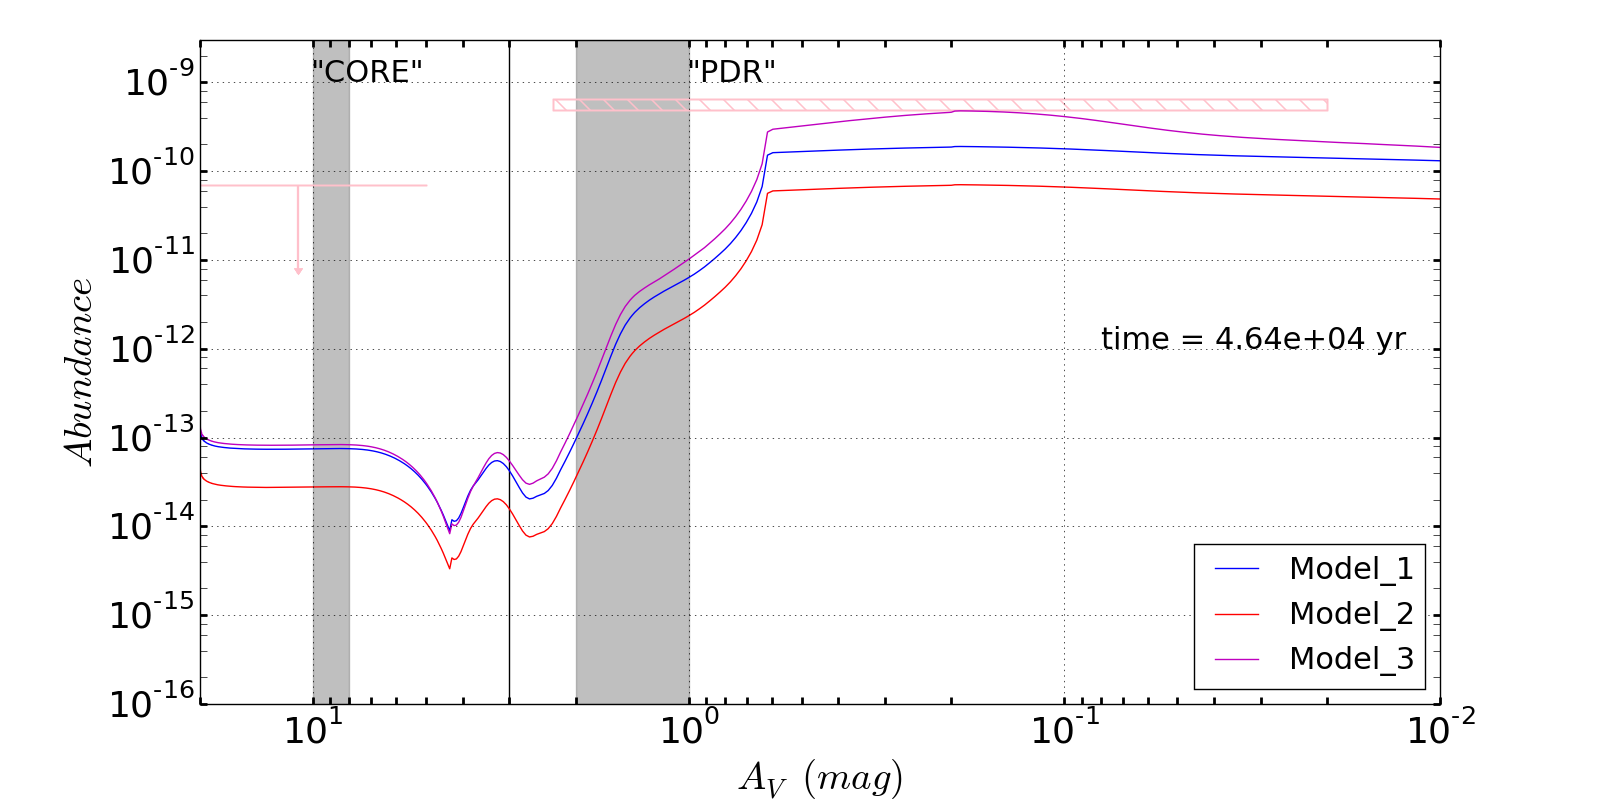
Fig. 5
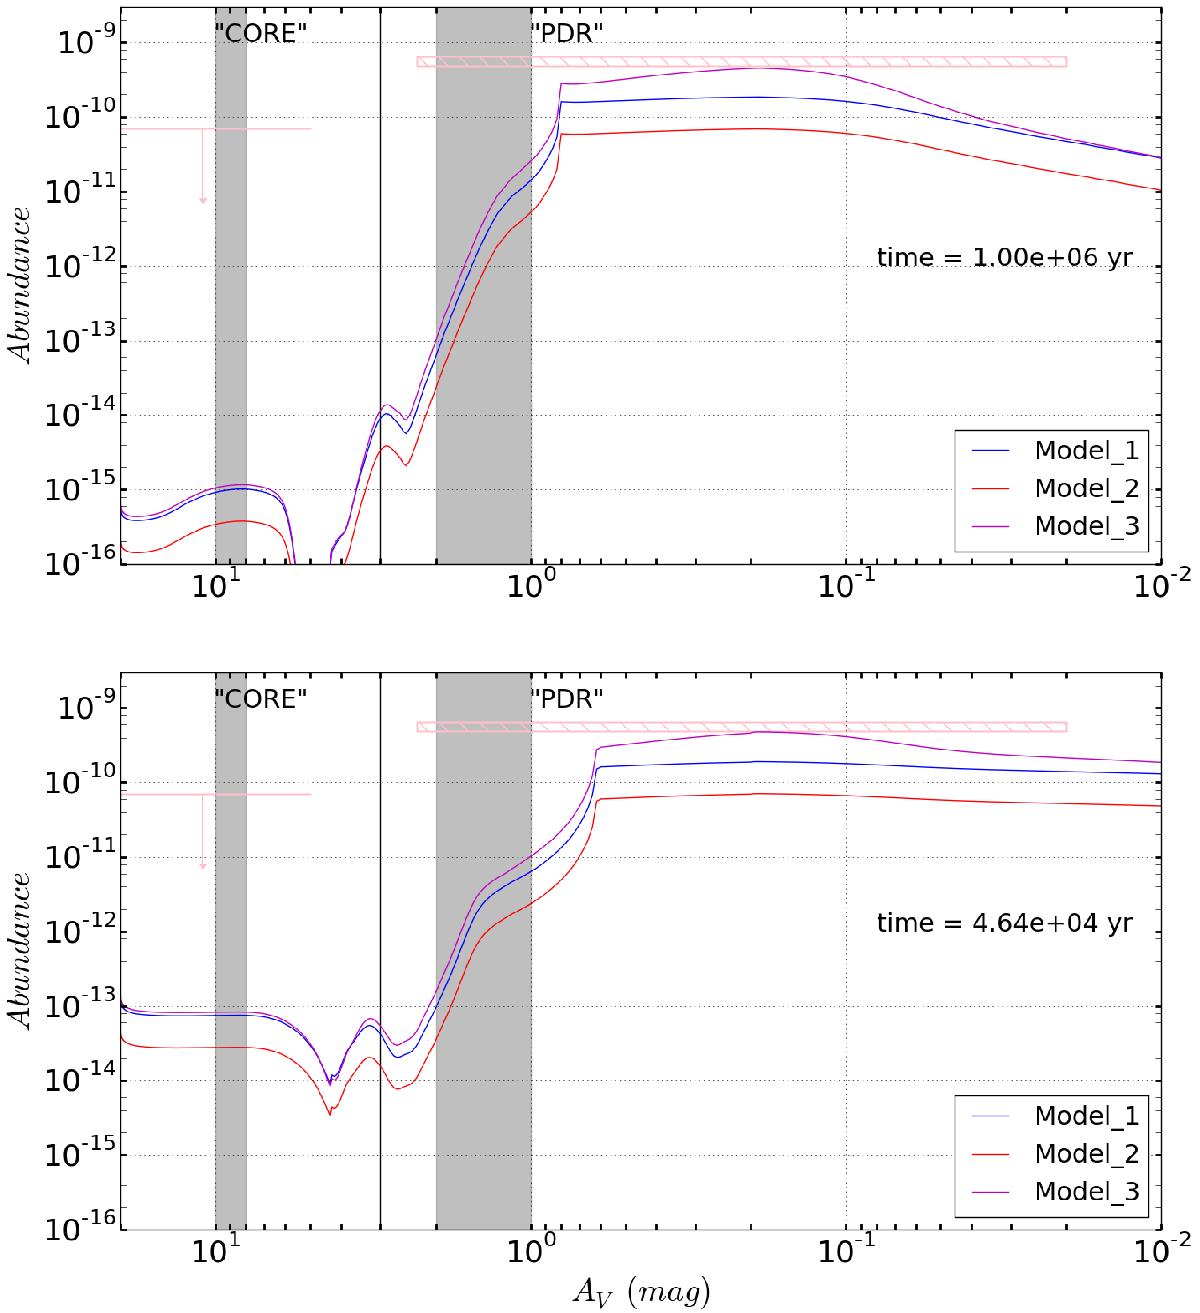
Comparison between the observed Guzman et al. (2012) and calculated abundances of CF+ in both the Core and the PDR positions of the Horsehead nebula at 4.64 × 10⁴ yr and 1 × 10⁶ yr. Three different models are considered here concerning the fluorine chemistry: Model 1, corresponding to the one described in Sect. 2.3; Model 2, which contains a lower fluorine abundance (Goicoechea et al. 2006), and Model 3, with improved reaction rate coefficients discussed in the text. The model results are represented by the solid curves and the observations by the upper limit and hatched box represented in pink.
Current usage metrics show cumulative count of Article Views (full-text article views including HTML views, PDF and ePub downloads, according to the available data) and Abstracts Views on Vision4Press platform.
Data correspond to usage on the plateform after 2015. The current usage metrics is available 48-96 hours after online publication and is updated daily on week days.
Initial download of the metrics may take a while.