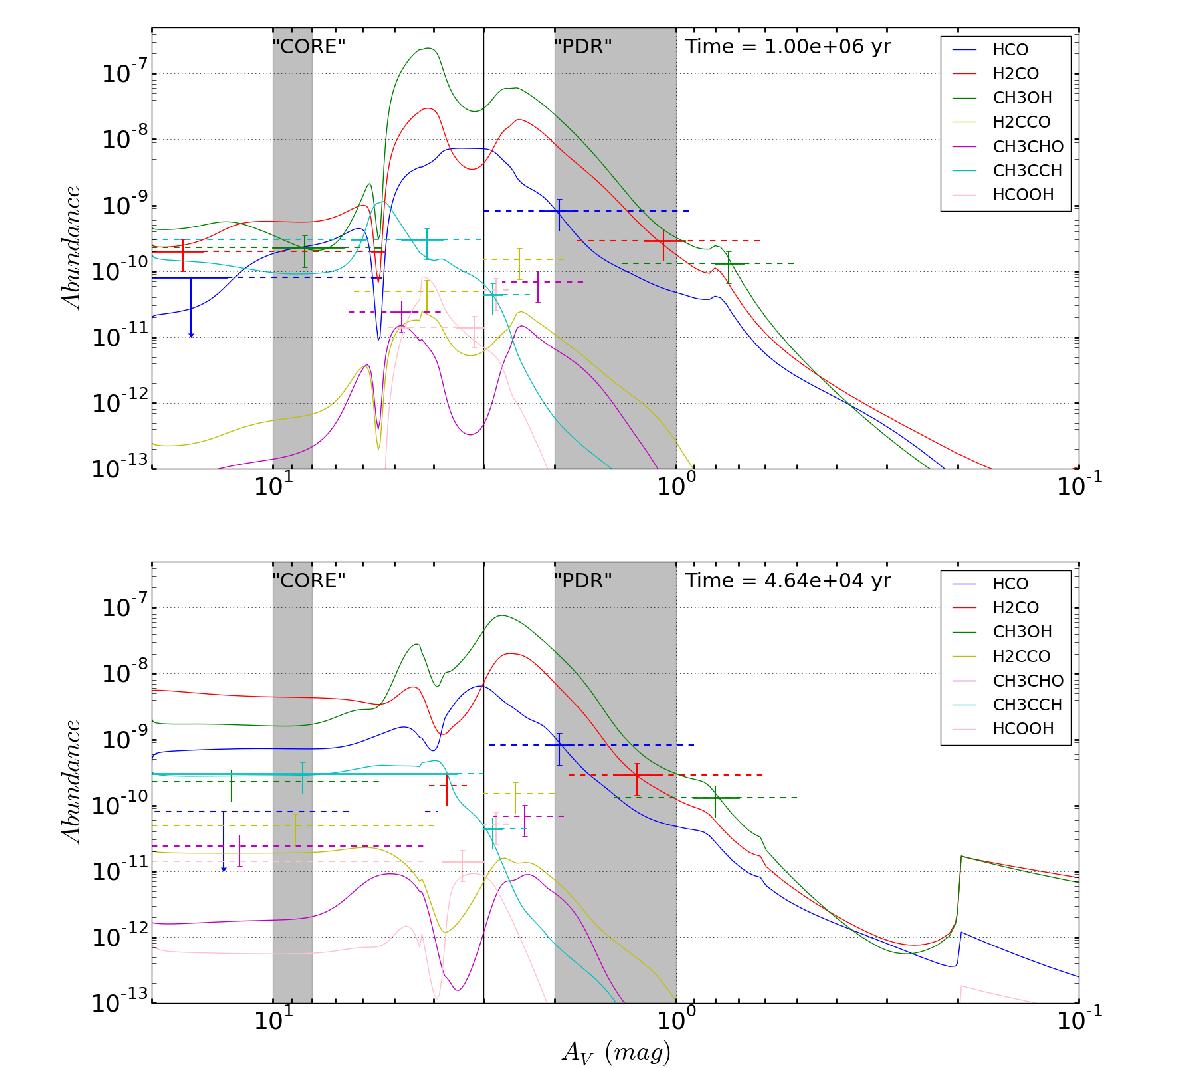
Fig. 2

Comparison between the observed and modeled abundances in the Horsehead nebula for HCO and the six organic molecules listed in the first column of Table 1, at two typical early and late times. The model results are represented by solid curves and the observations by vertical error bars which refer to a 50% error in the abundances (Guzman et al. 2014), and horizontal lines, which are solid where our model can reproduce the observed abundances within their error bars and dashed where the agreement is only within a standard factor of ten. The grayish boxes indicate the approximate AV ranges at which the observations were performed in each region, according to the corresponding published articles.
Current usage metrics show cumulative count of Article Views (full-text article views including HTML views, PDF and ePub downloads, according to the available data) and Abstracts Views on Vision4Press platform.
Data correspond to usage on the plateform after 2015. The current usage metrics is available 48-96 hours after online publication and is updated daily on week days.
Initial download of the metrics may take a while.


