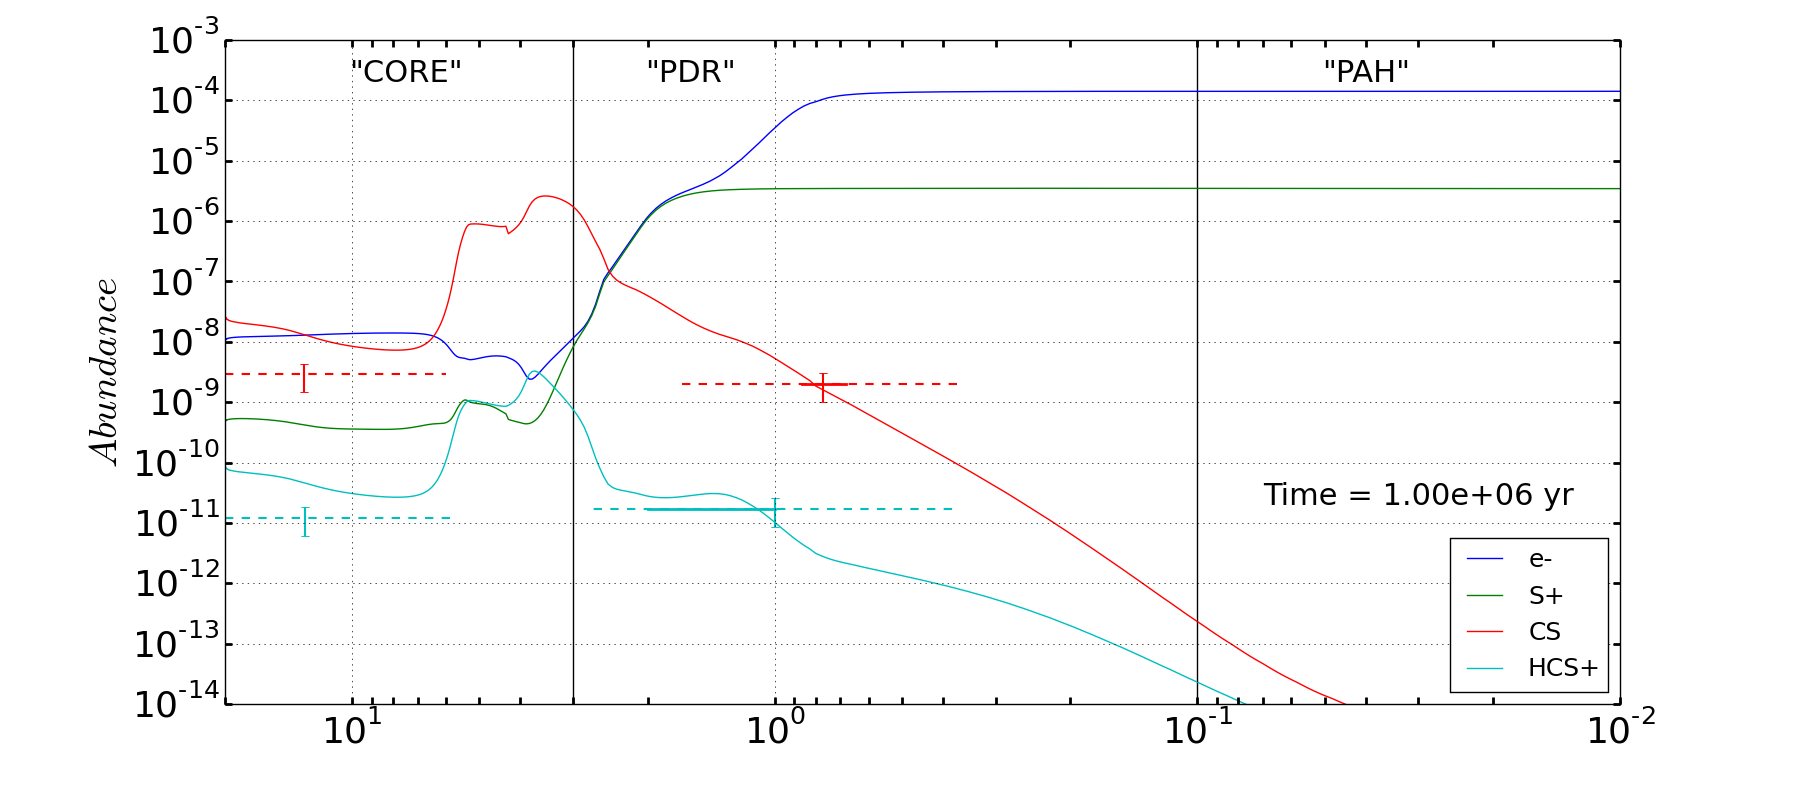
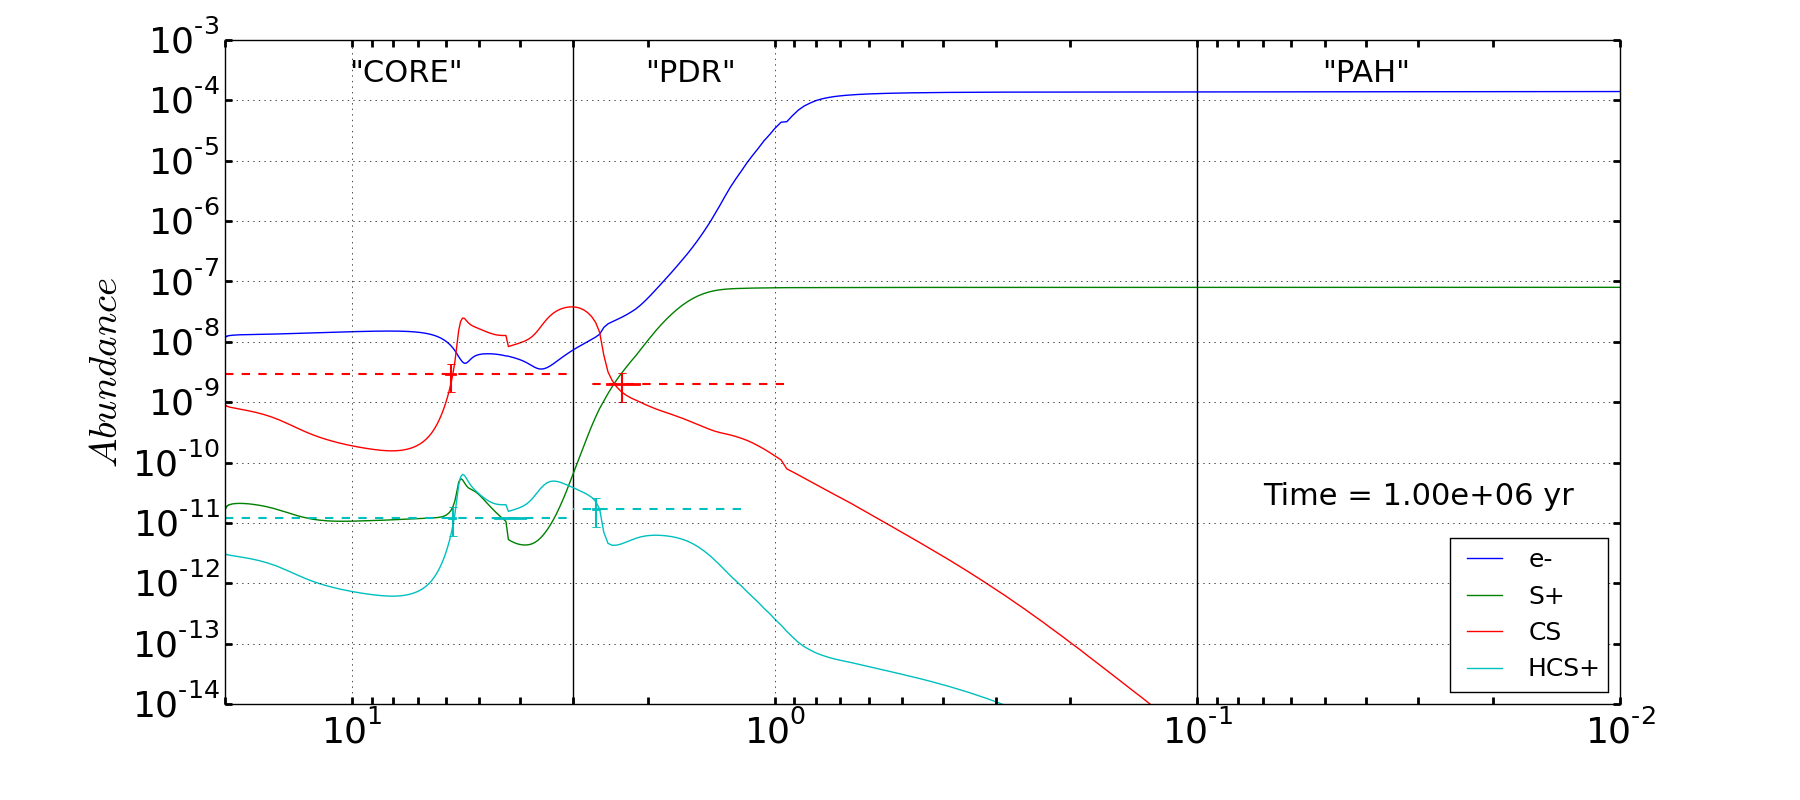
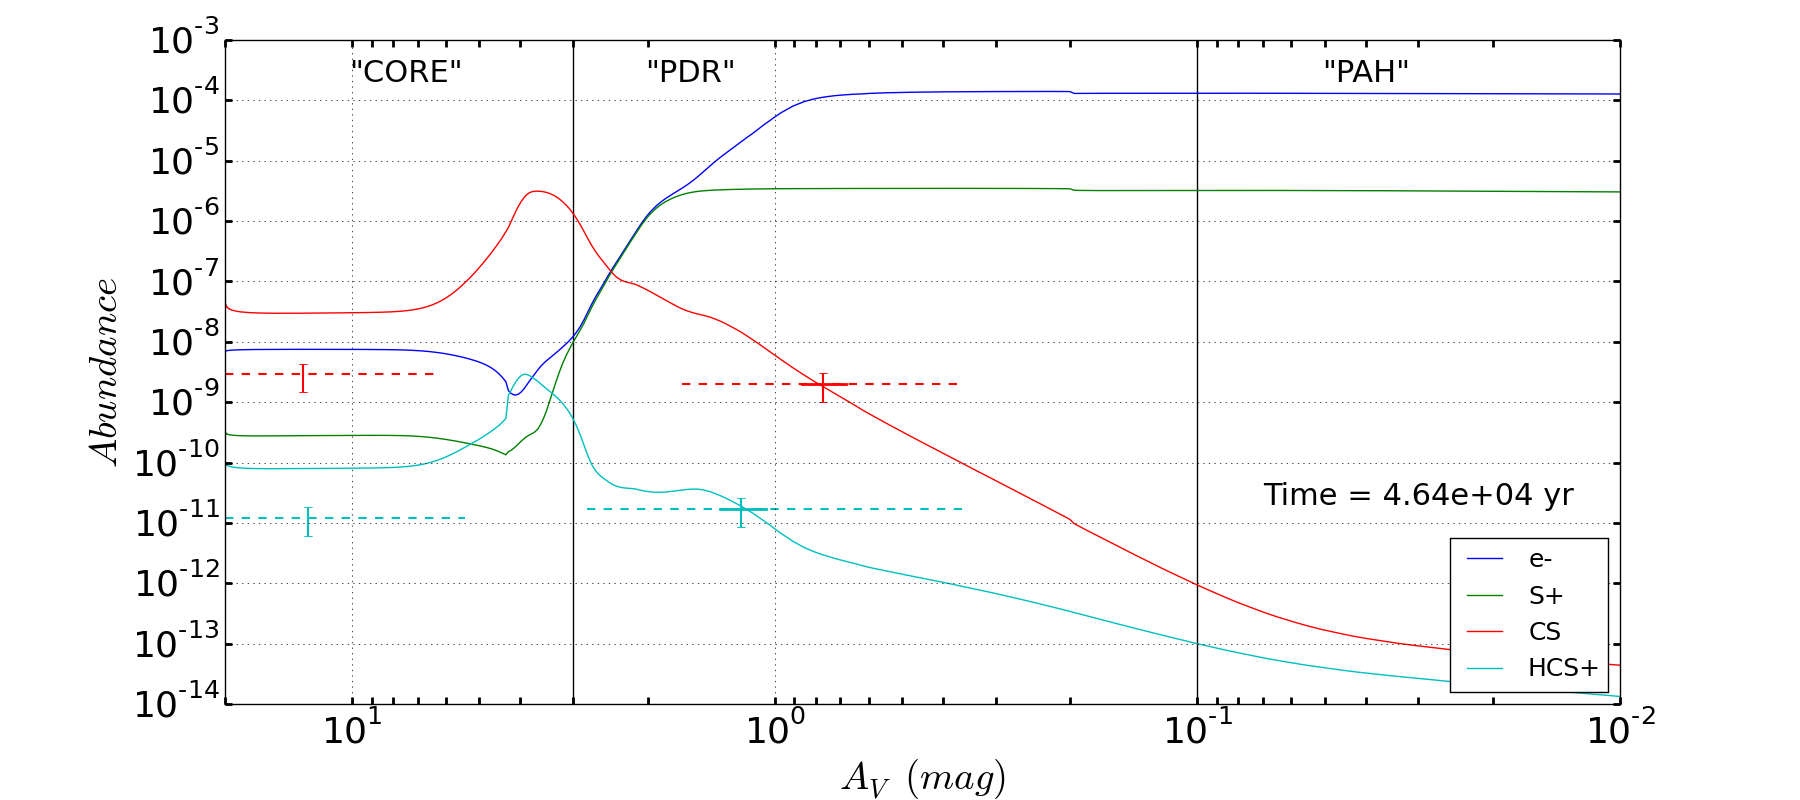
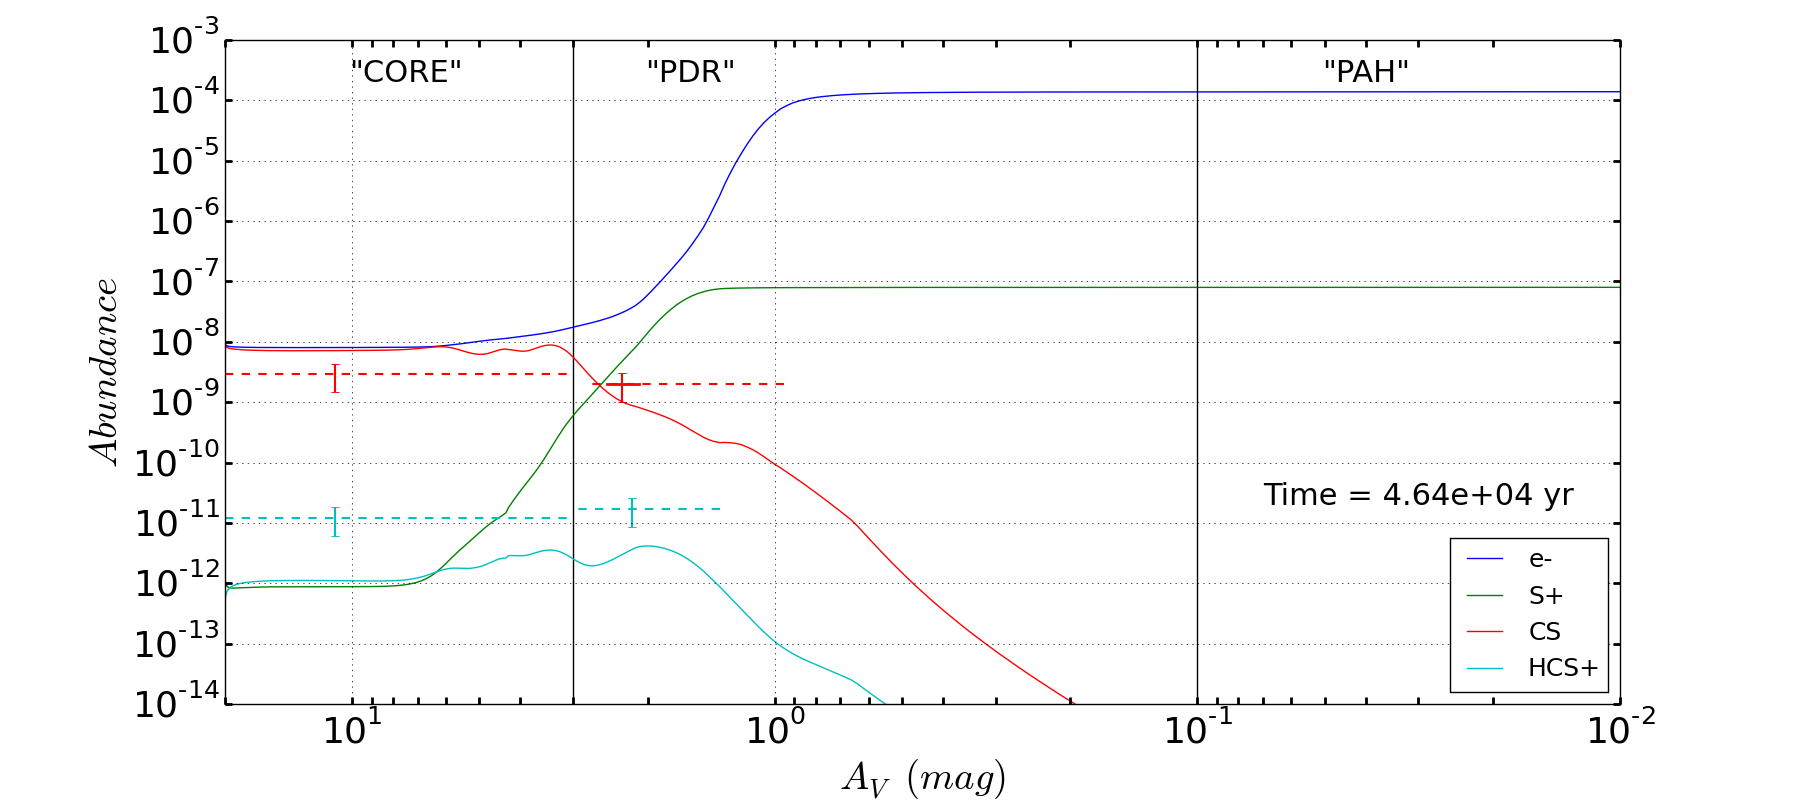
Fig. 10
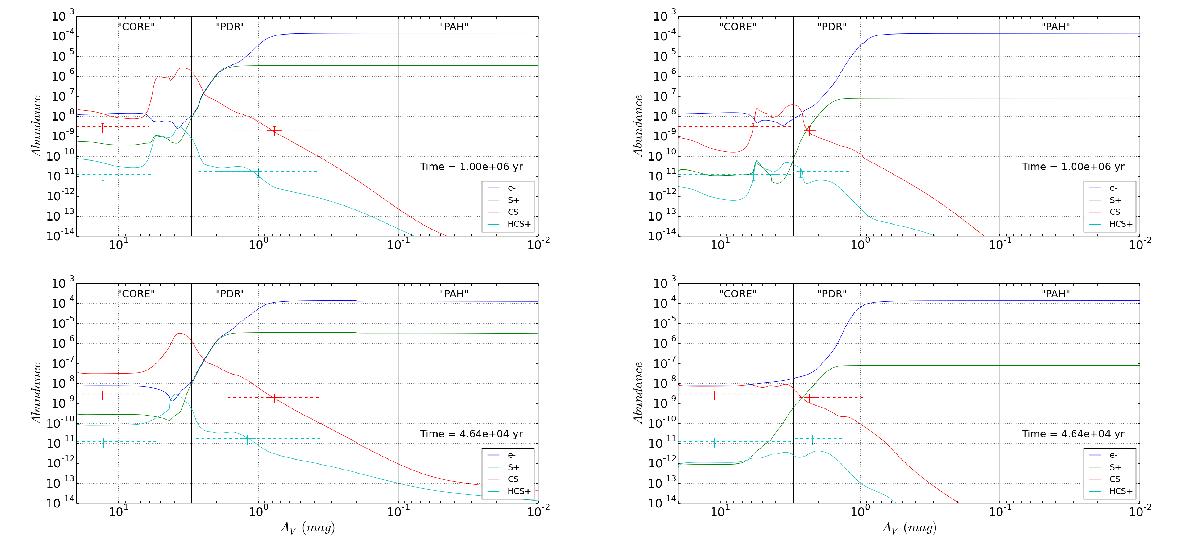
Same as Figs. 8 and 9 but here representing the predicted abundances for selected sulfur-bearing species for two different elemental amount of sulfur: a high elemental abundance of 3.5 × 10⁻⁶ in the left panels and low elemental abundance of 8.0 × 10⁻⁸ in the right panels (see Sect. 4.5). The error bars represent the observational values from Guzman et al. (2014).
Current usage metrics show cumulative count of Article Views (full-text article views including HTML views, PDF and ePub downloads, according to the available data) and Abstracts Views on Vision4Press platform.
Data correspond to usage on the plateform after 2015. The current usage metrics is available 48-96 hours after online publication and is updated daily on week days.
Initial download of the metrics may take a while.