Free Access
Fig. 7
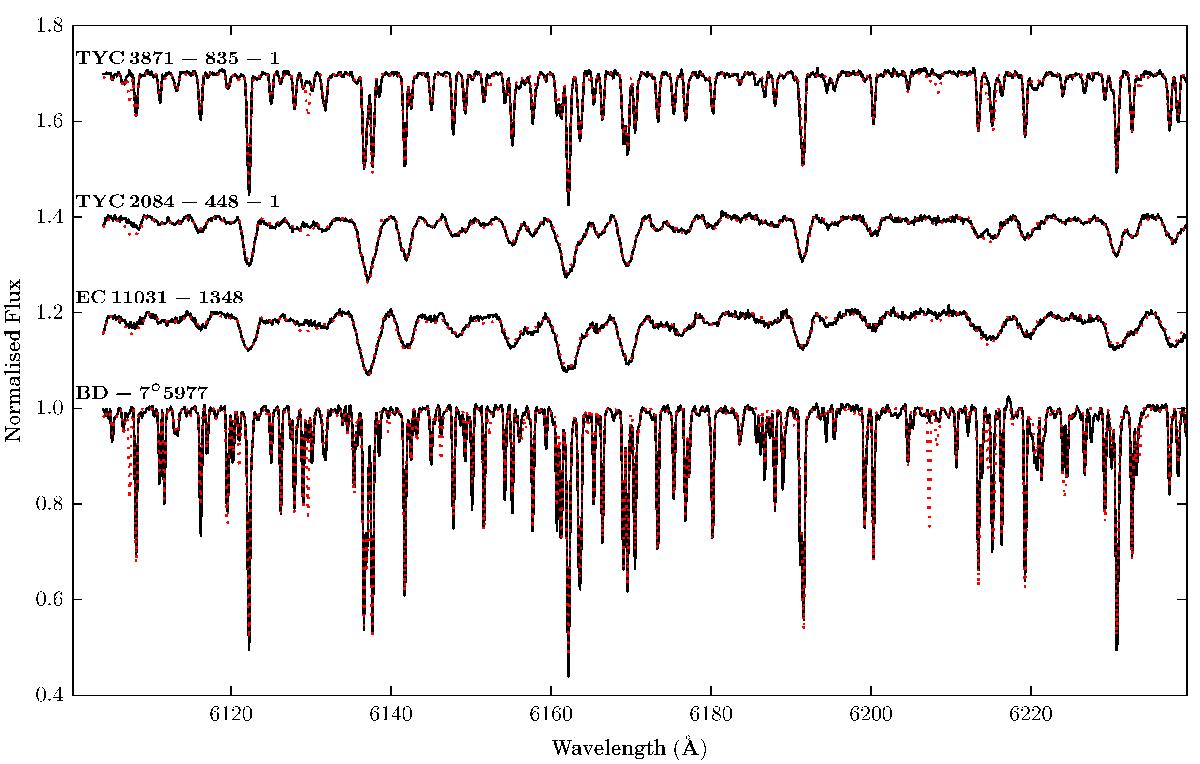
Observed normalised and co-added HERMES spectra (black full line) and the best fitting GSSP model (red dotted line) for a section of the wavelength range used to determine the spectroscopic parameters with the GSSP code.
Current usage metrics show cumulative count of Article Views (full-text article views including HTML views, PDF and ePub downloads, according to the available data) and Abstracts Views on Vision4Press platform.
Data correspond to usage on the plateform after 2015. The current usage metrics is available 48-96 hours after online publication and is updated daily on week days.
Initial download of the metrics may take a while.