Fig. 3
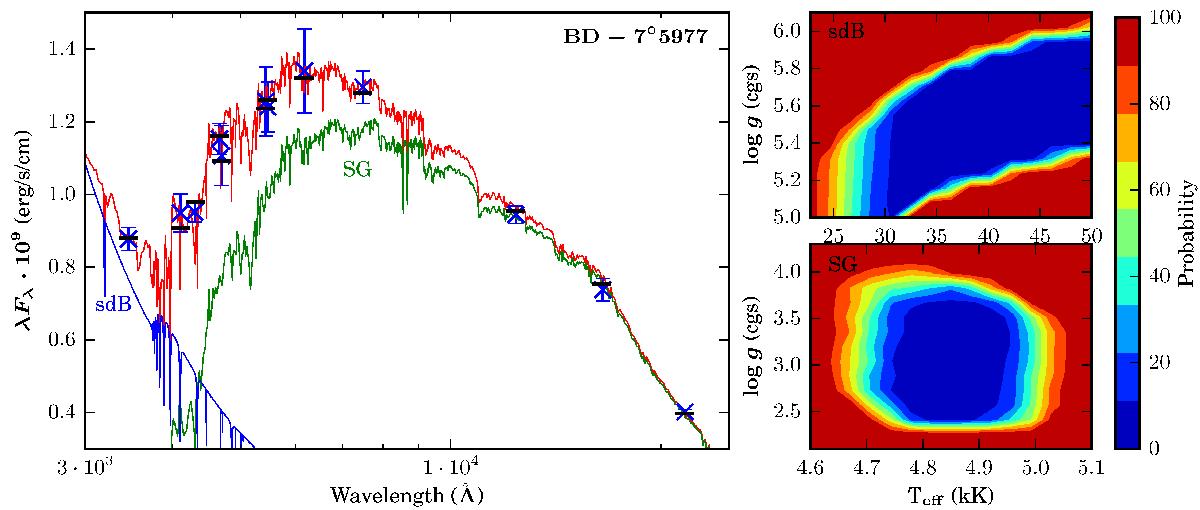
Photometric SED of BD-7°5977 with the best fitting model (left panel) and the confidence intervals for the effective temperature and surface gravity of both components (right panels). The observed photometry is plotted in blue crosses, while the synthetic best fit photometry is plotted in black horizontal line. The best fitting binary model is shown with a red line, while the models for the cool companion and sdB star are show respectively with a green and a blue line.
Current usage metrics show cumulative count of Article Views (full-text article views including HTML views, PDF and ePub downloads, according to the available data) and Abstracts Views on Vision4Press platform.
Data correspond to usage on the plateform after 2015. The current usage metrics is available 48-96 hours after online publication and is updated daily on week days.
Initial download of the metrics may take a while.