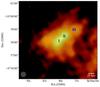
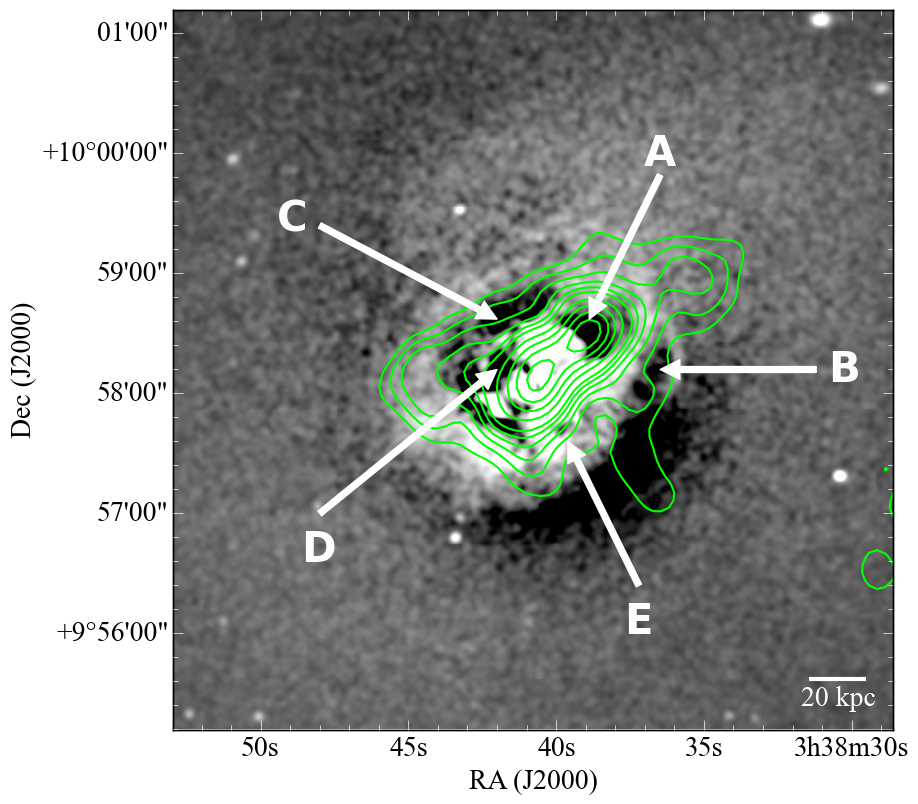
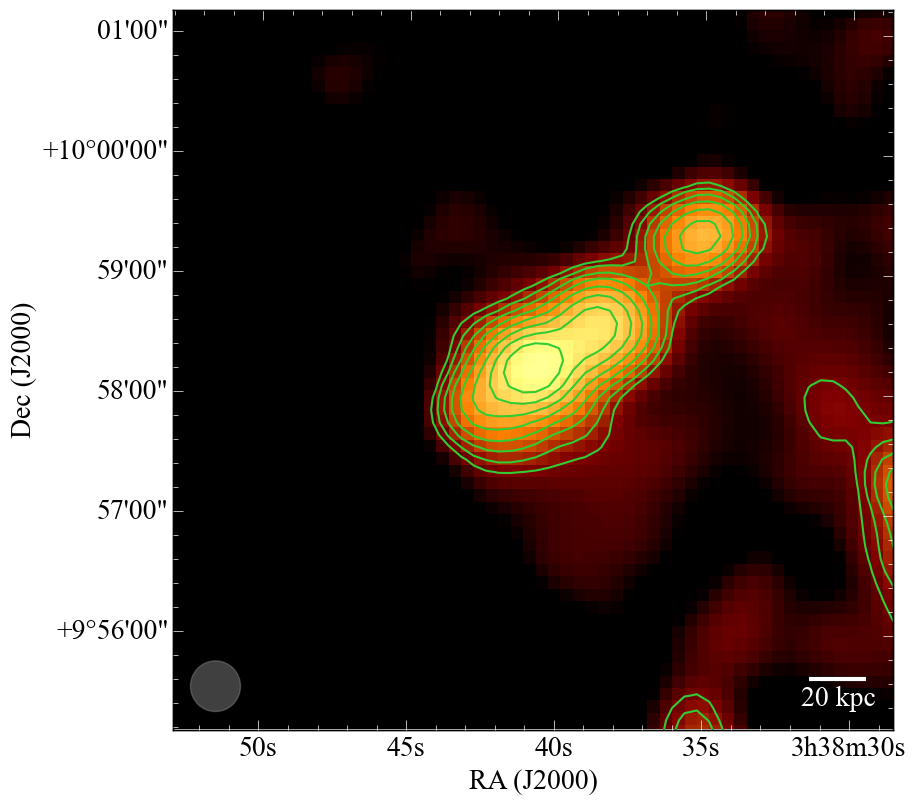
Fig. 3
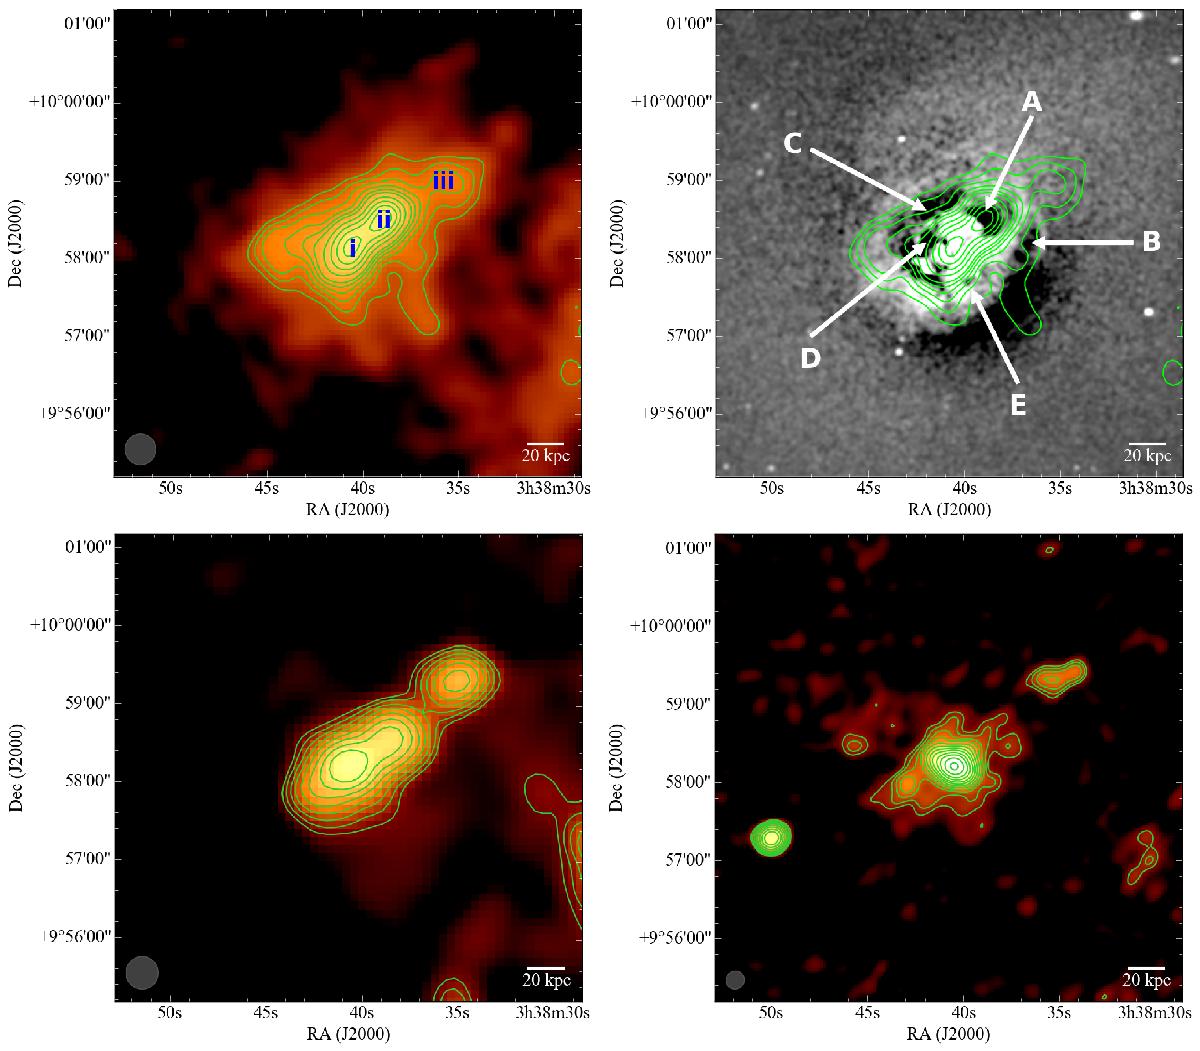
2A0335+096. Top left: reprocessed MSSS map with resolution 23.6′′ × 23.6′′ and rms noise 11 mJy/beam. Contours start at 5σ level and correspond to 55 mJy/beam × [1, 1.2, 1.4, 1.6, 1.8, 2, 2.4, 2.8, 3.2, 3.6]. Individual features are labeled i, ii, and iii. These are discussed in the text. Top right: Chandra X-ray surface brightness residual map. The image is produced by unsharp masking using archival data in the 0.5–7 keV band with total exposure of 101 ks after standard filtering. Green contours correspond to the MSSS image. The five cavities identified by Sanders et al. (2009) are marked. The correspondence between these features and our radio map is discussed in the text. Bottom left: TGSS map with resolution 25.3′′ × 25.0′′ and rms noise 5 mJy/beam. Contours start at 3σ level and correspond to 15 mJy/beam × [1, 1.4, 2, 2.8, 4, 5.7, 8, 11]. Bottom right: radio map at 1.5 GHz from Bîrzan et al. (2008). Contours correspond to 0.25 mJy/beam × [1, 1.4, 2, 2.8, 4, 5.7, 8, 11, 16, 22, 32, 45].

Current usage metrics show cumulative count of Article Views (full-text article views including HTML views, PDF and ePub downloads, according to the available data) and Abstracts Views on Vision4Press platform.
Data correspond to usage on the plateform after 2015. The current usage metrics is available 48-96 hours after online publication and is updated daily on week days.
Initial download of the metrics may take a while.