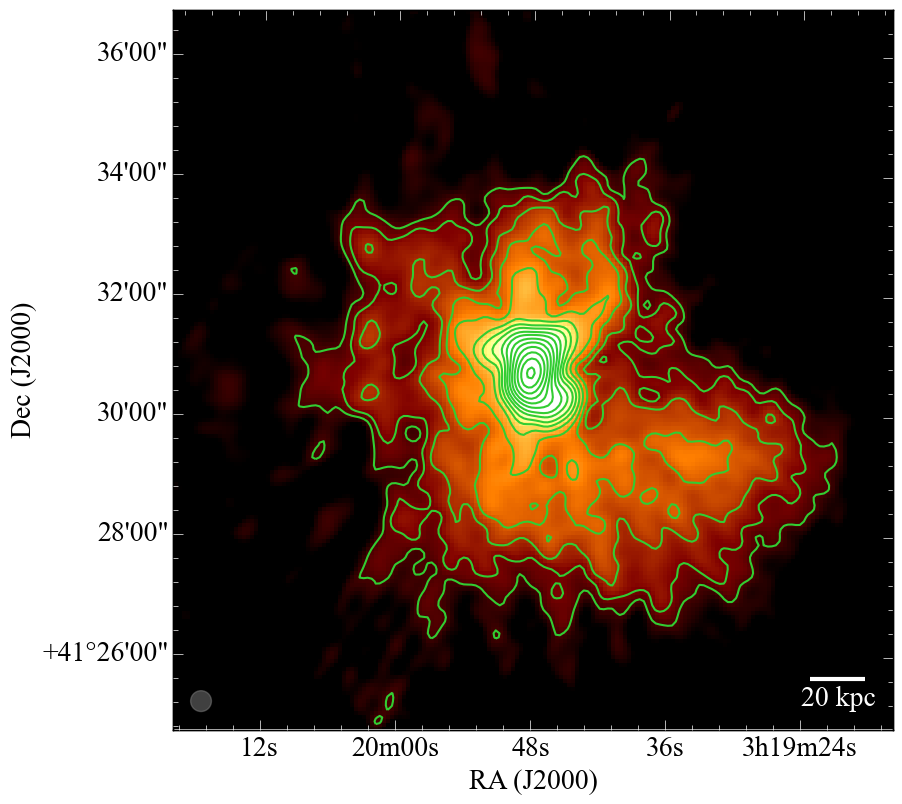
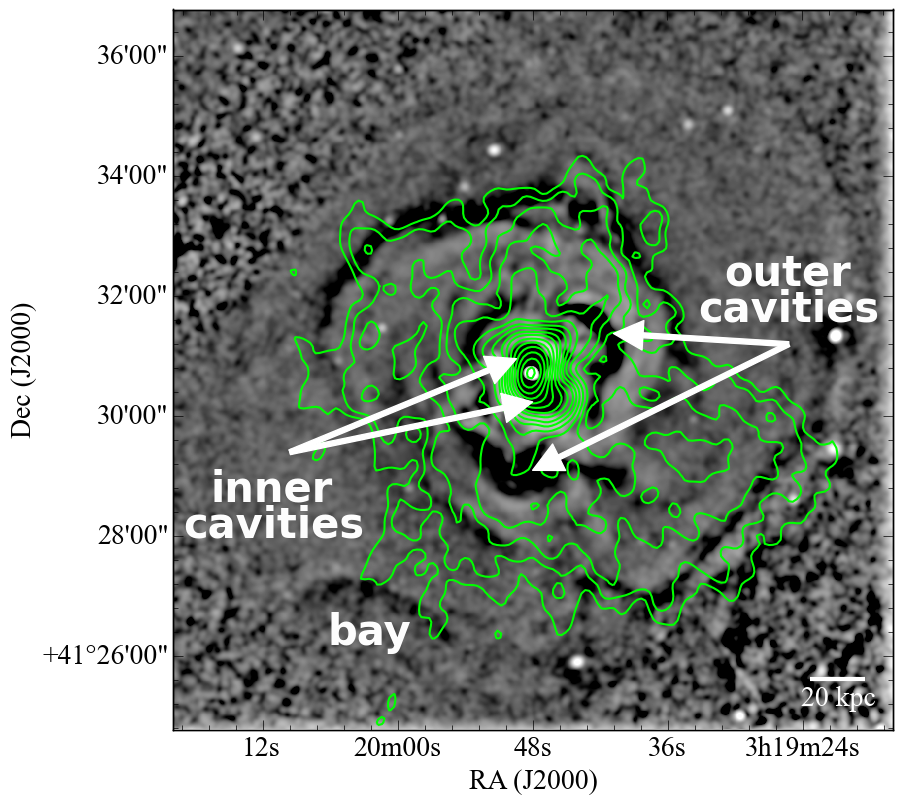
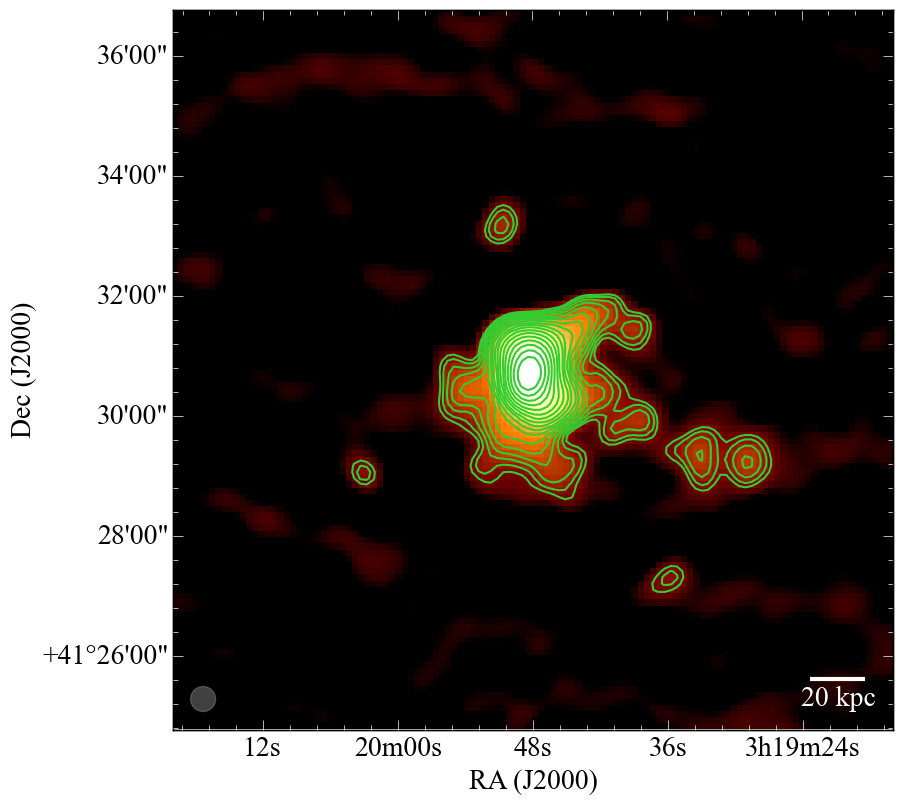
Fig. 2
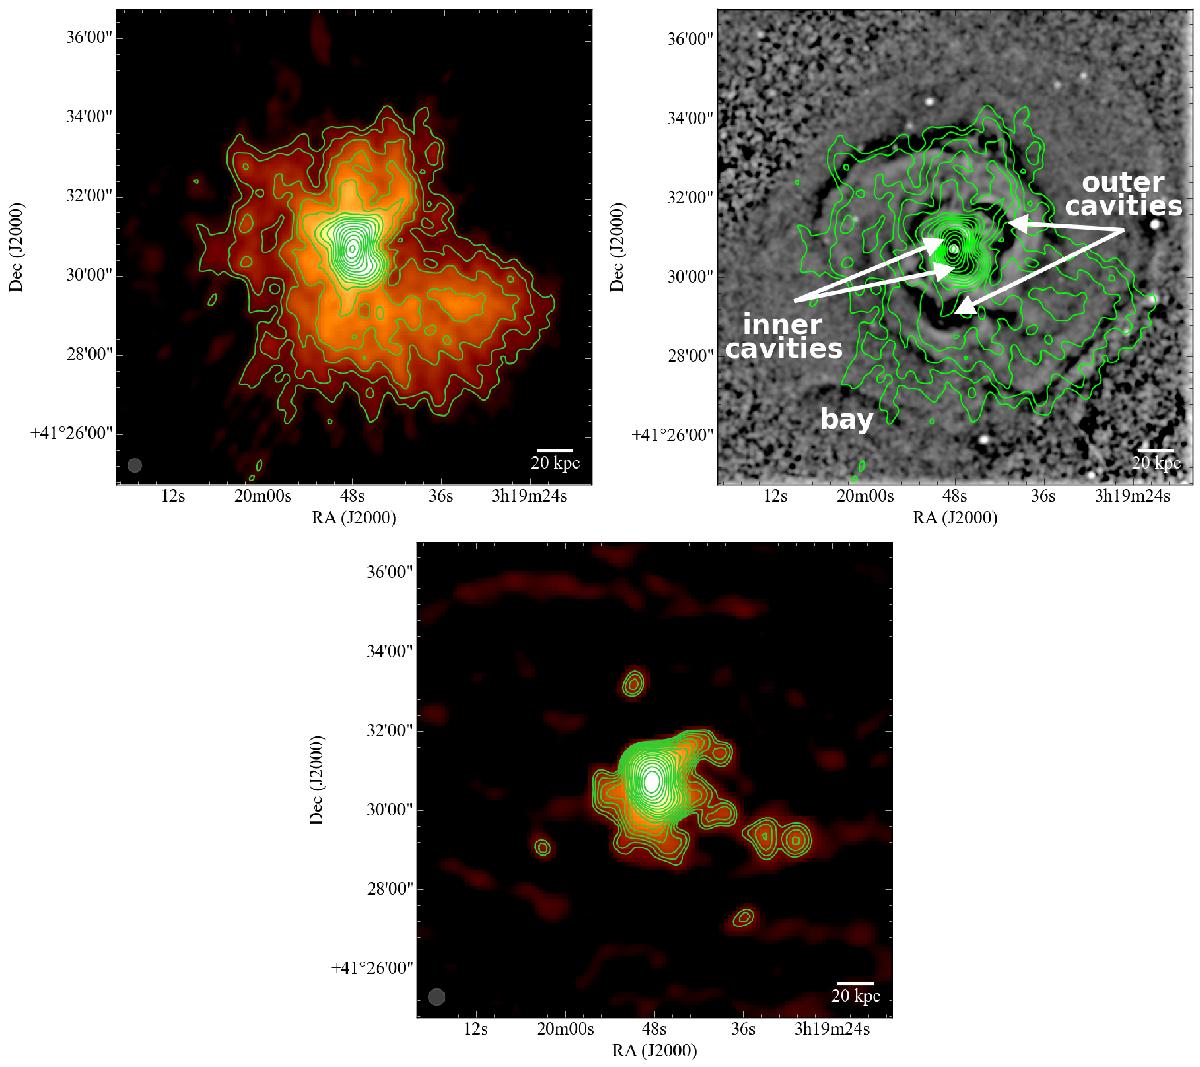
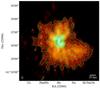
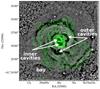
Perseus cluster. Top left: reprocessed MSSS map with resolution 20.8′′ × 20.8′′ and rms noise 20 mJy/beam. The contours start at 5σ level and are drawn at 100 mJy/beam × [1, 1.4, 2, 2.8, 4, 5.7, 8, 11, 16, 22, 32, 45, 64, 91, 128]. Top right: Chandra X-ray surface brightness residual map. The image is produced by unsharp masking using archival data in the 0.5–7 keV band with total exposure of 1.4 Ms after standard filtering. Contours correspond to the MSSS image. Bottom: TGSS map with resolution 25.0′′ × 25.0′′ and rms noise 10 mJy/beam. The contours start at 5σ level and are drawn at 50 mJy/beam × [1, 1.4, 2, 2.8, 4, 5.7, 8, 11, 16, 22, 32, 45, 64, 91, 128, 182, 256].
Current usage metrics show cumulative count of Article Views (full-text article views including HTML views, PDF and ePub downloads, according to the available data) and Abstracts Views on Vision4Press platform.
Data correspond to usage on the plateform after 2015. The current usage metrics is available 48-96 hours after online publication and is updated daily on week days.
Initial download of the metrics may take a while.