Fig. 6
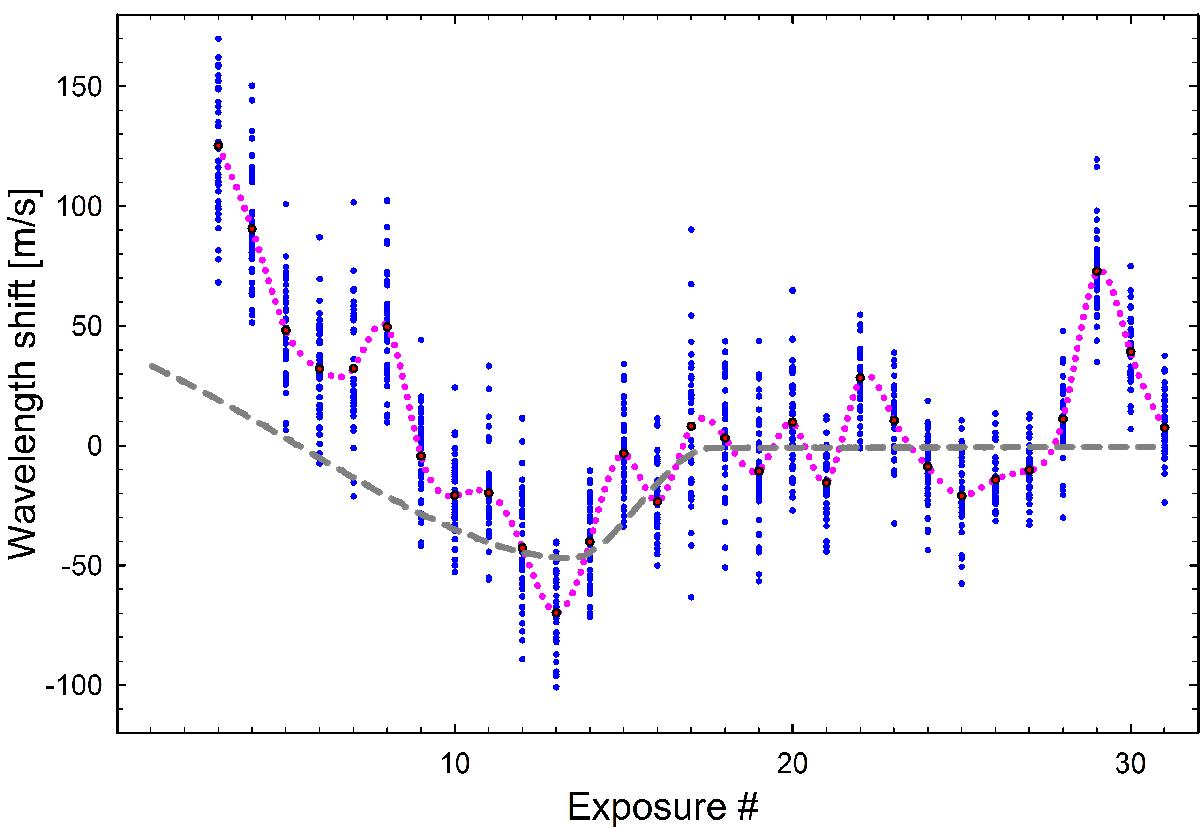
Observed wavelength positions of individual lines (dots) drift slowly but systematically between successive exposures. The shifts are common for all spectral lines (trend in dotted red). Superposed (dashed gray) is the expected Rossiter-McLaughlin effect, as measured with an iodine cell at the Keck-1 HIRES spectrometer, using a similar spectral resolution in the same wavelength region (Winn et al. 2005). The wavelength scale shows relative shifts only.
Current usage metrics show cumulative count of Article Views (full-text article views including HTML views, PDF and ePub downloads, according to the available data) and Abstracts Views on Vision4Press platform.
Data correspond to usage on the plateform after 2015. The current usage metrics is available 48-96 hours after online publication and is updated daily on week days.
Initial download of the metrics may take a while.