Fig. 3
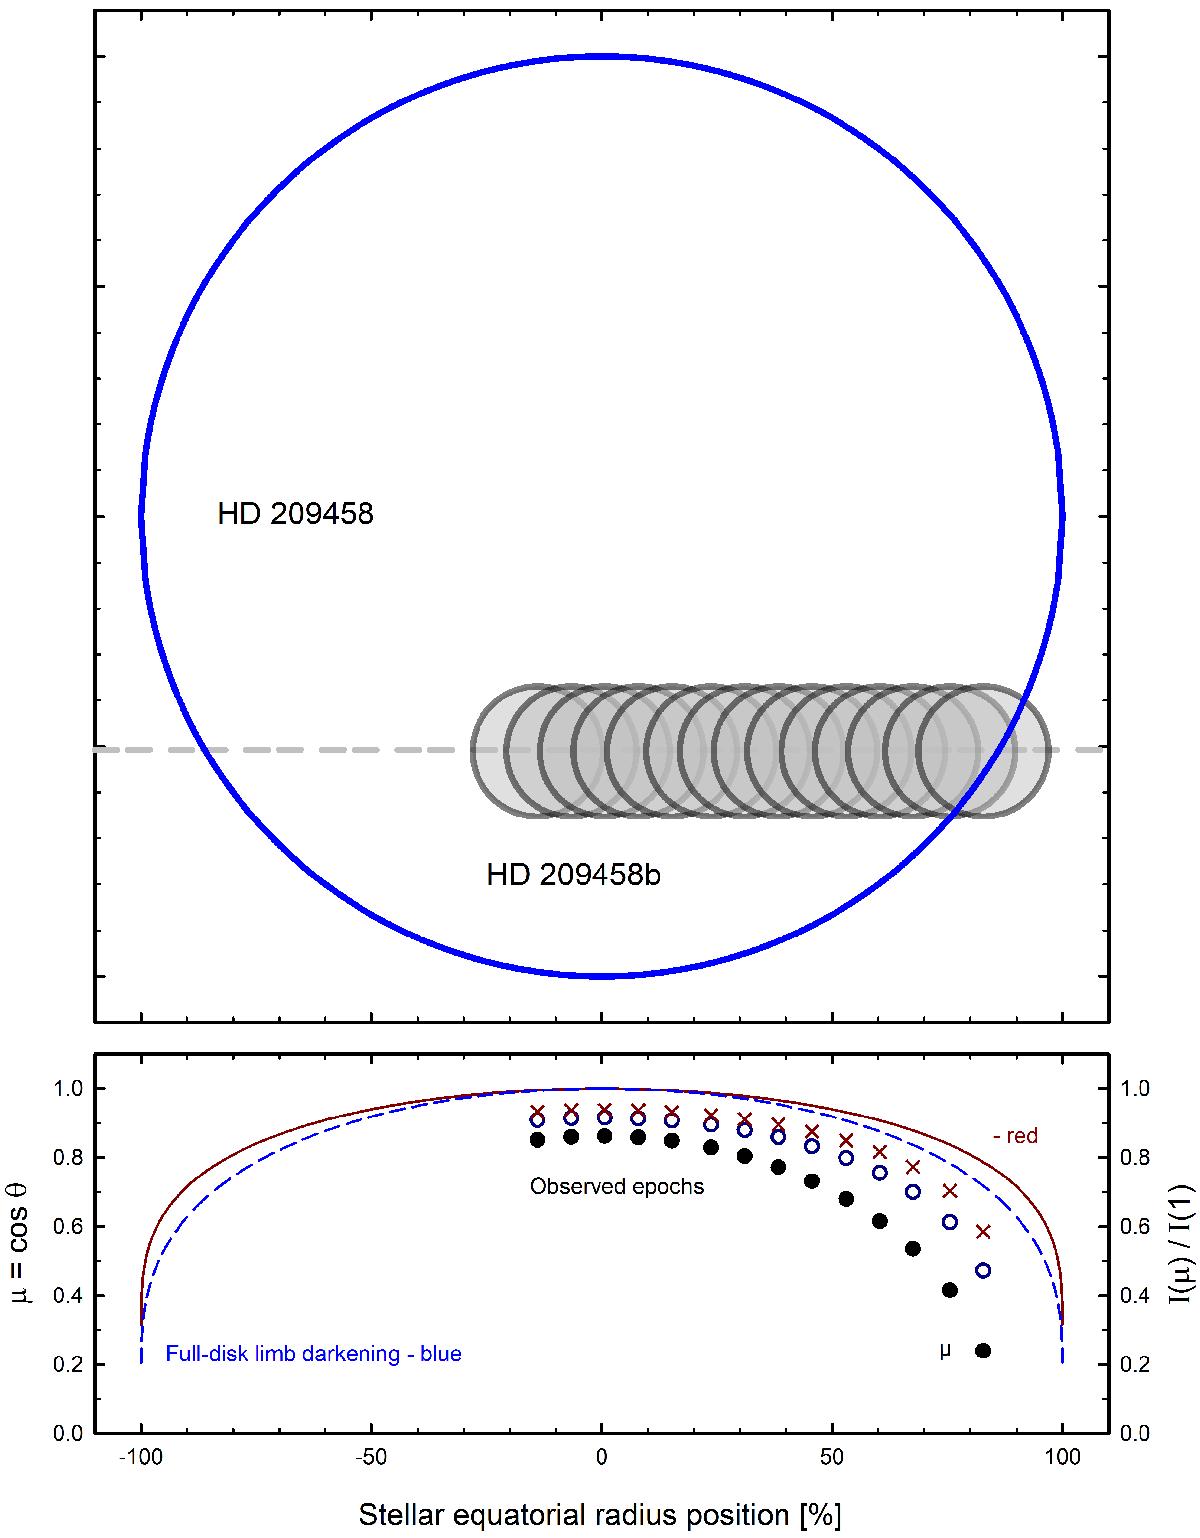
Exoplanet transit geometry during the observing night. The planet size and positions during successive REDL spectral exposures are to scale. The bottom panel shows curves for the theoretical limb-darkening functions in red and blue for the full disk, along the stellar equator (scales at right and bottom). Solid dots show the stellar center angle μ = cos θ at the observed epochs (scales at left and bottom, also top panel), with μ ranging between 0.86 and 0.24. These values lie below the full-disk curves since the transit does not reach the disk center. For these observed epochs, the limb-darkening values in blue (open circles) and red (crosses) are shown as ratios between intensity at the actual planet location and disk center (scales at right and bottom). At the final epochs, part of the planet is already outside the stellar disk.
Current usage metrics show cumulative count of Article Views (full-text article views including HTML views, PDF and ePub downloads, according to the available data) and Abstracts Views on Vision4Press platform.
Data correspond to usage on the plateform after 2015. The current usage metrics is available 48-96 hours after online publication and is updated daily on week days.
Initial download of the metrics may take a while.