Fig. 17
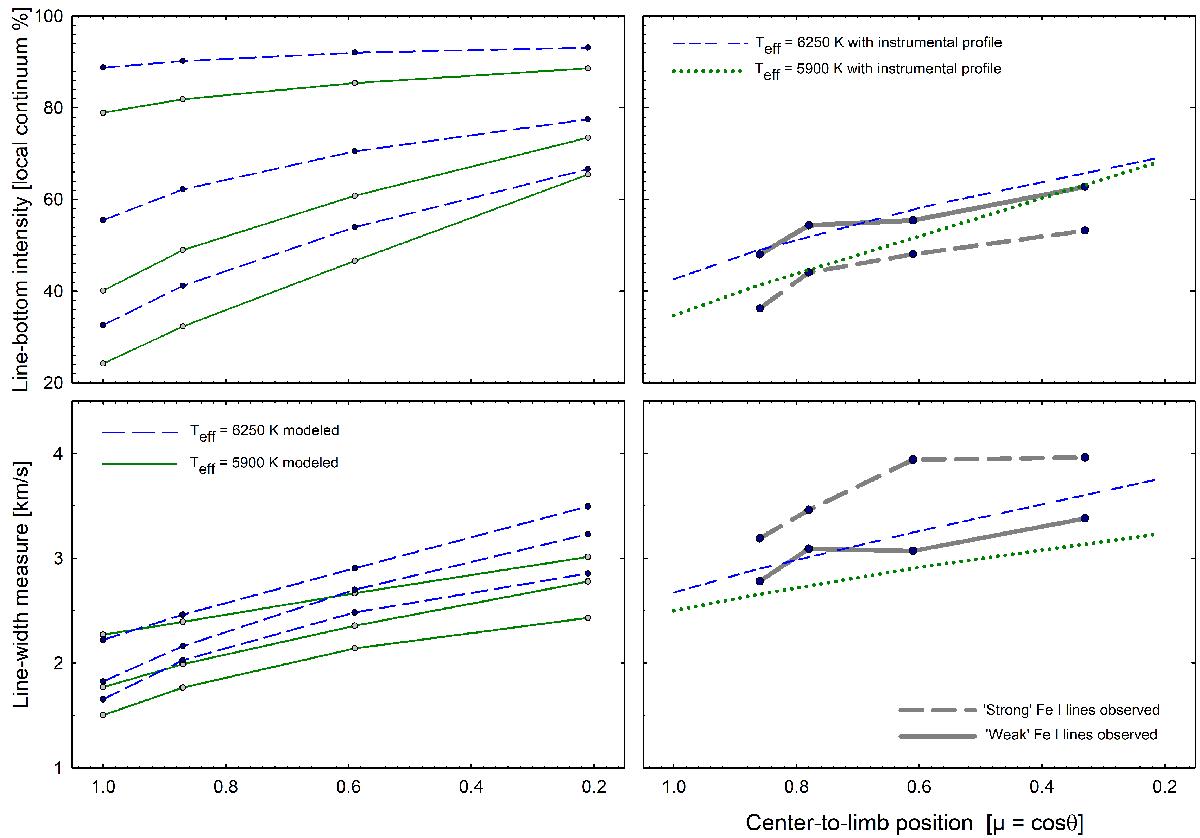
Observed and modeled center-to-limb behavior for line depths and widths. Predictions from CO 5BOLD models with parameters bracketing those of HD 209458 are shown. Left panels show theoretical center-to-limb changes for differently strong lines at full spectral resolution; the right-hand panels compare observations (bold curves) to synthetic profiles degraded with the spectrometer instrumental profile. Line widths and depths were obtained by fitting modified Gaussian functions to both observed and modeled line profiles.
Current usage metrics show cumulative count of Article Views (full-text article views including HTML views, PDF and ePub downloads, according to the available data) and Abstracts Views on Vision4Press platform.
Data correspond to usage on the plateform after 2015. The current usage metrics is available 48-96 hours after online publication and is updated daily on week days.
Initial download of the metrics may take a while.