Fig. 13
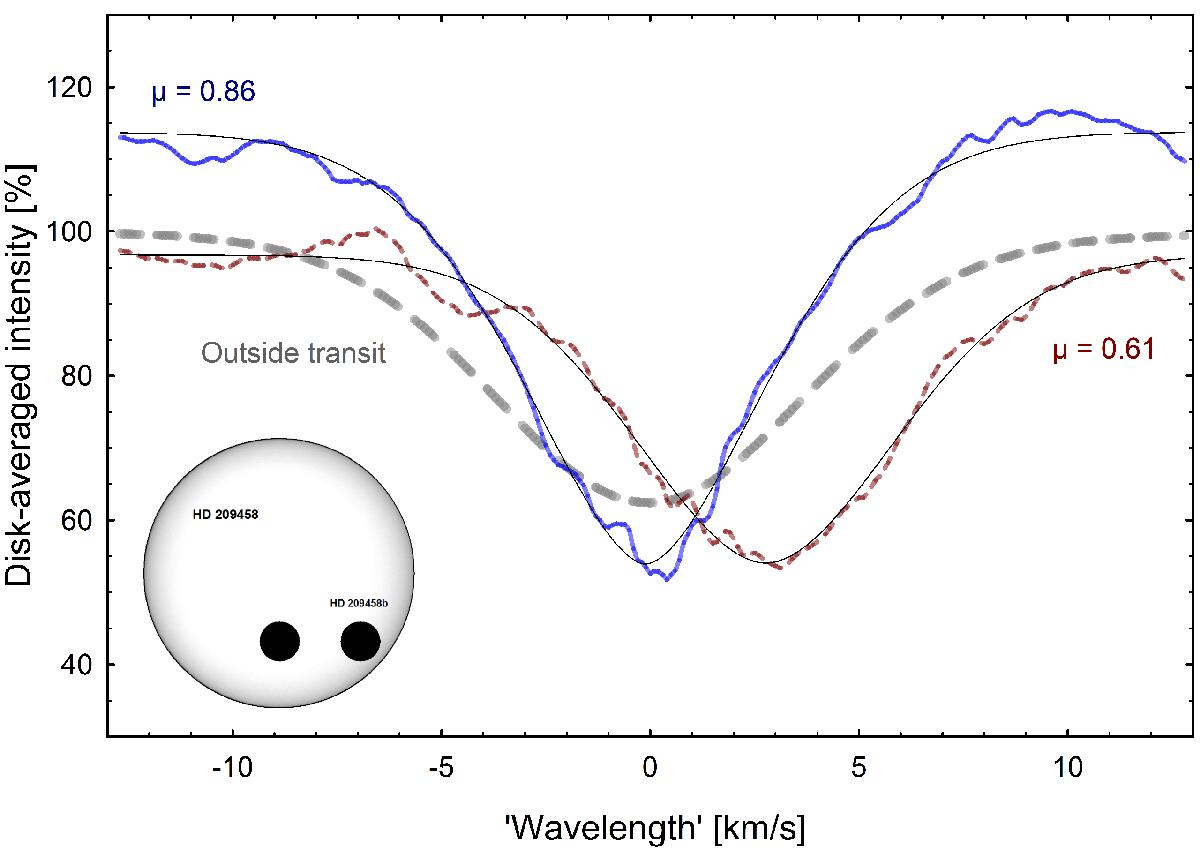
Center-to-limb variations in reconstructed line profiles. The solid blue curve is the average of five exposures near stellar disk center with mean μ = 0.86; the dashed dark red curve is the average over four exposures closer to limb, ⟨ μ ⟩ = 0.61. The fitted thin curves are modified Gaussians; the observed profile outside transit is bold dashed gray. The intensity scale is that of the stellar disk-averaged flux. Because of limb darkening, the local intensity close to disk center is higher, and that further away is lower than this average value. The planet size and disk positions are to scale.
Current usage metrics show cumulative count of Article Views (full-text article views including HTML views, PDF and ePub downloads, according to the available data) and Abstracts Views on Vision4Press platform.
Data correspond to usage on the plateform after 2015. The current usage metrics is available 48-96 hours after online publication and is updated daily on week days.
Initial download of the metrics may take a while.