Fig. 10
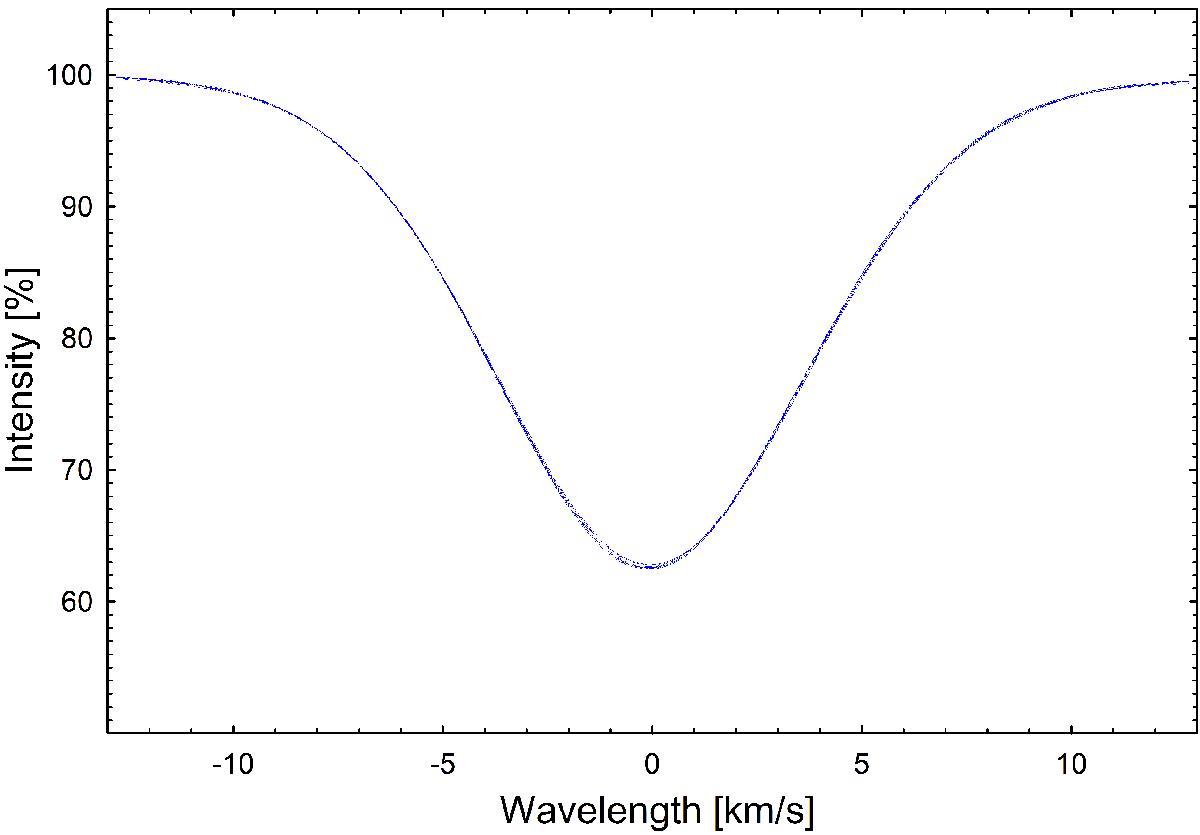
Representative profiles of the weaker Fe I line and its gradual changes. Each profile, which is the average of 26 Fe I lines, is plotted for 14 successive exposures during the exoplanet transit, showing the degree of uniformity reached. To appreciate the slight changes during the transit, this plot should be viewed highly magnified; corresponding line ratios are in Fig. 11. The photometric signal-to-noise ratio here is ~2500.
Current usage metrics show cumulative count of Article Views (full-text article views including HTML views, PDF and ePub downloads, according to the available data) and Abstracts Views on Vision4Press platform.
Data correspond to usage on the plateform after 2015. The current usage metrics is available 48-96 hours after online publication and is updated daily on week days.
Initial download of the metrics may take a while.