Fig. 9
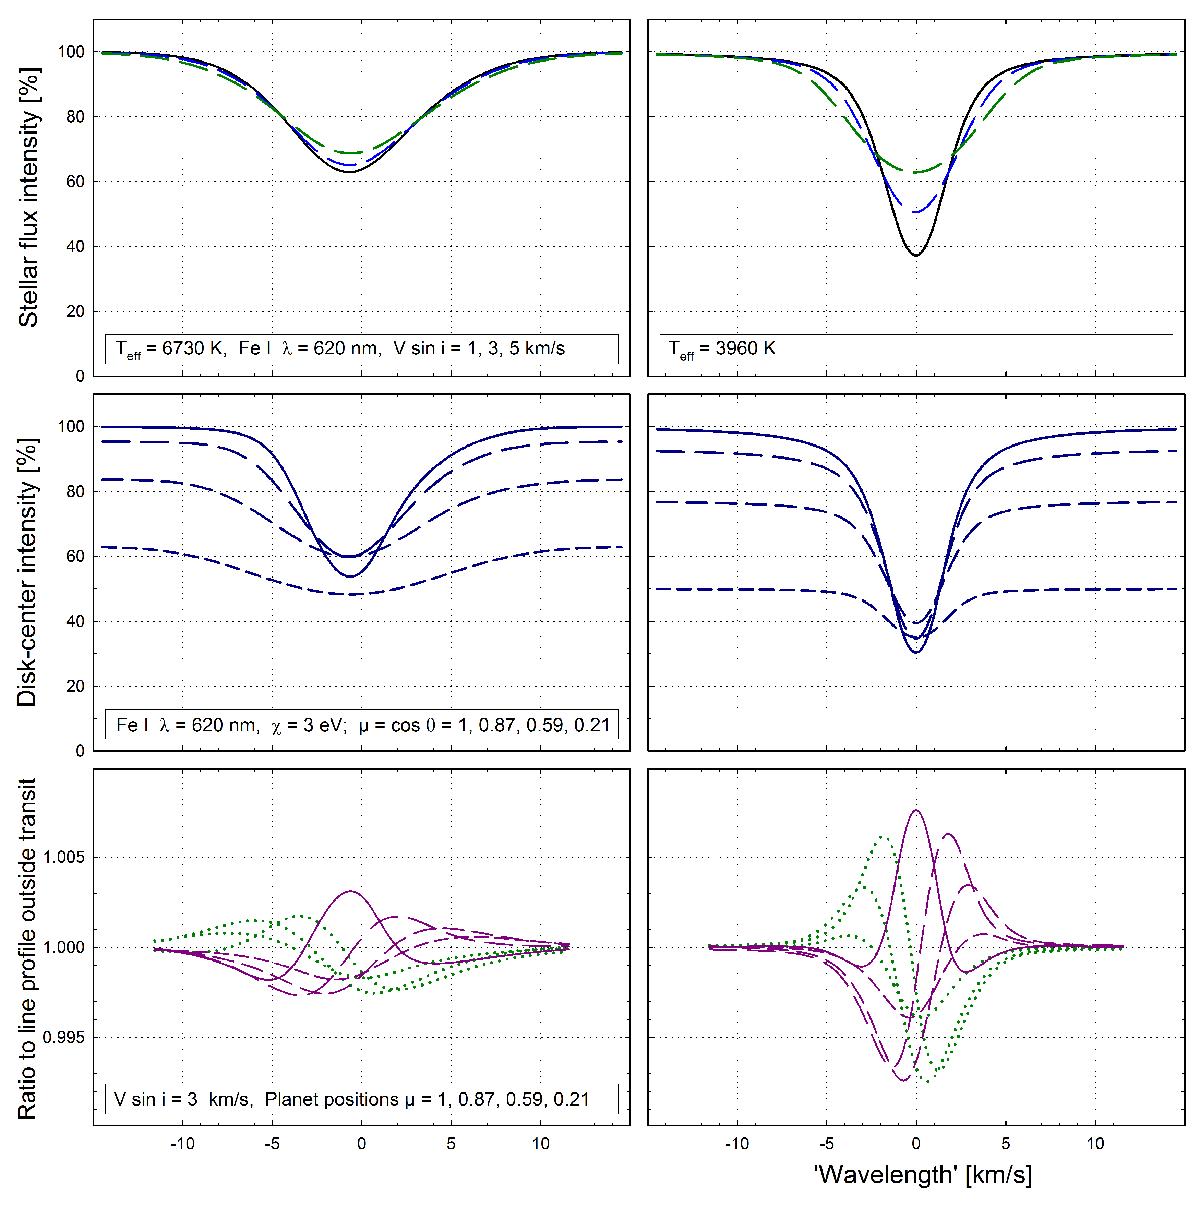
Observable signatures during the transit of an exoplanet covering 1.5% of the surface in a hotter (“F3 V”; left) and a cooler star (“K8 V”; right). Top row shows line profiles in integrated starlight for three rotational velocities V sin i = 1, 3 and 5 km s-1. Middle row shows spatially resolved line components at four different center-to-limb positions. Such profiles can be disentangled from observations as in the bottom row: ratios of observed line profiles at each transit epoch to the line profile outside transit. Red solid curves show these ratios at a planet position in front of stellar disk center. Curves for positions from disk center toward the limb in a prograde planetary orbit are represented with successively shorter dashes. Dotted green curves indicate the corresponding planet positions on the ingress side of the stellar disk; because of stellar line asymmetries, these do not exactly mirror those on the egress side.
Current usage metrics show cumulative count of Article Views (full-text article views including HTML views, PDF and ePub downloads, according to the available data) and Abstracts Views on Vision4Press platform.
Data correspond to usage on the plateform after 2015. The current usage metrics is available 48-96 hours after online publication and is updated daily on week days.
Initial download of the metrics may take a while.