Fig. 5
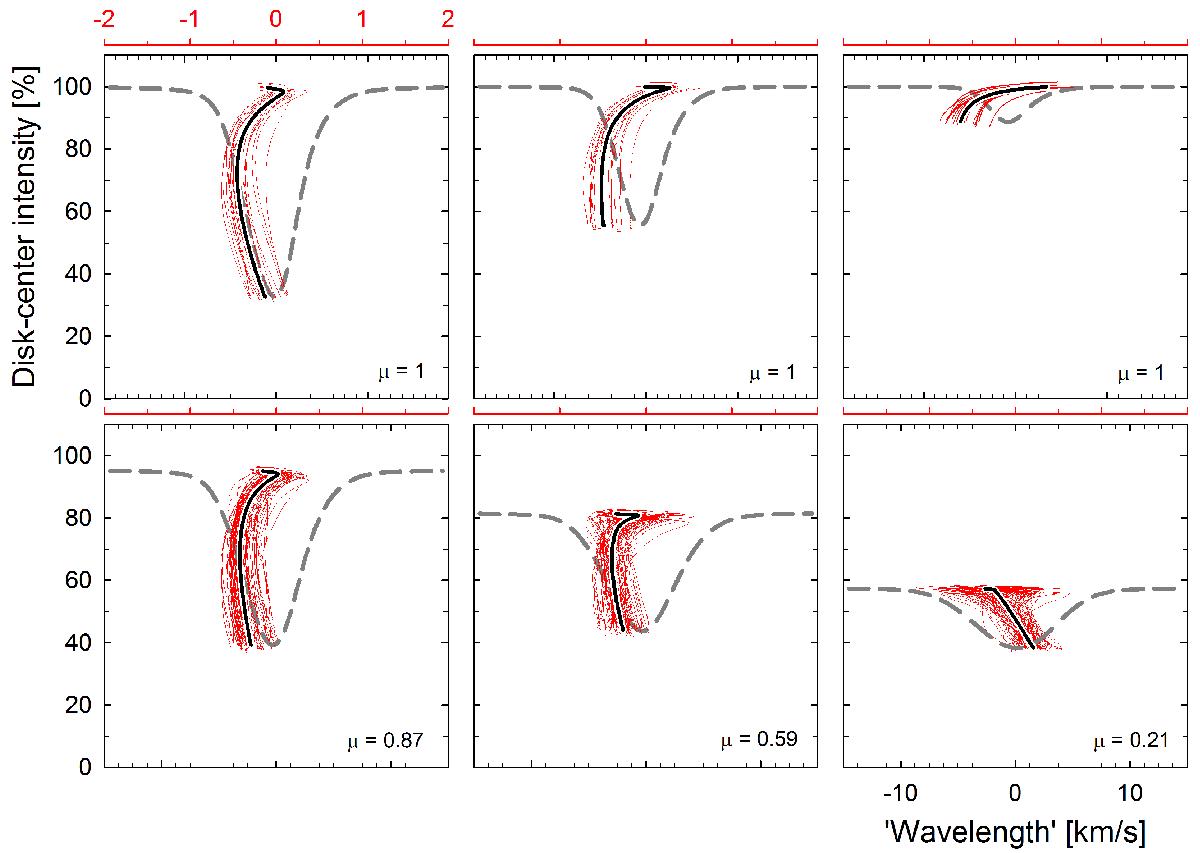
Build-up of line asymmetries in synthetic Fe I lines from the “F7 V” model. Thin red lines (scales in km s-1 at top) are bisectors of line profiles obtained as spatial averages for each of 20 temporal snapshots in the simulation, with global averages shown as bold black lines for the bisectors, and dashed for the line profiles (scales at bottom). Top: stellar disk center (μ = 1), three different line strengths. Bottom: center to limb changes of the stronger line. The bisector spread illustrates the time variability and also how extensive averaging that is required to reach a statistically stable signal. Line shapes converge toward a stable mean (indicated by similar bisectors) sooner than their shifts. The “blueward hook” of some bisectors near the continuum is an indicator of spatial inhomogeneities in line formation.
Current usage metrics show cumulative count of Article Views (full-text article views including HTML views, PDF and ePub downloads, according to the available data) and Abstracts Views on Vision4Press platform.
Data correspond to usage on the plateform after 2015. The current usage metrics is available 48-96 hours after online publication and is updated daily on week days.
Initial download of the metrics may take a while.