Fig. 4
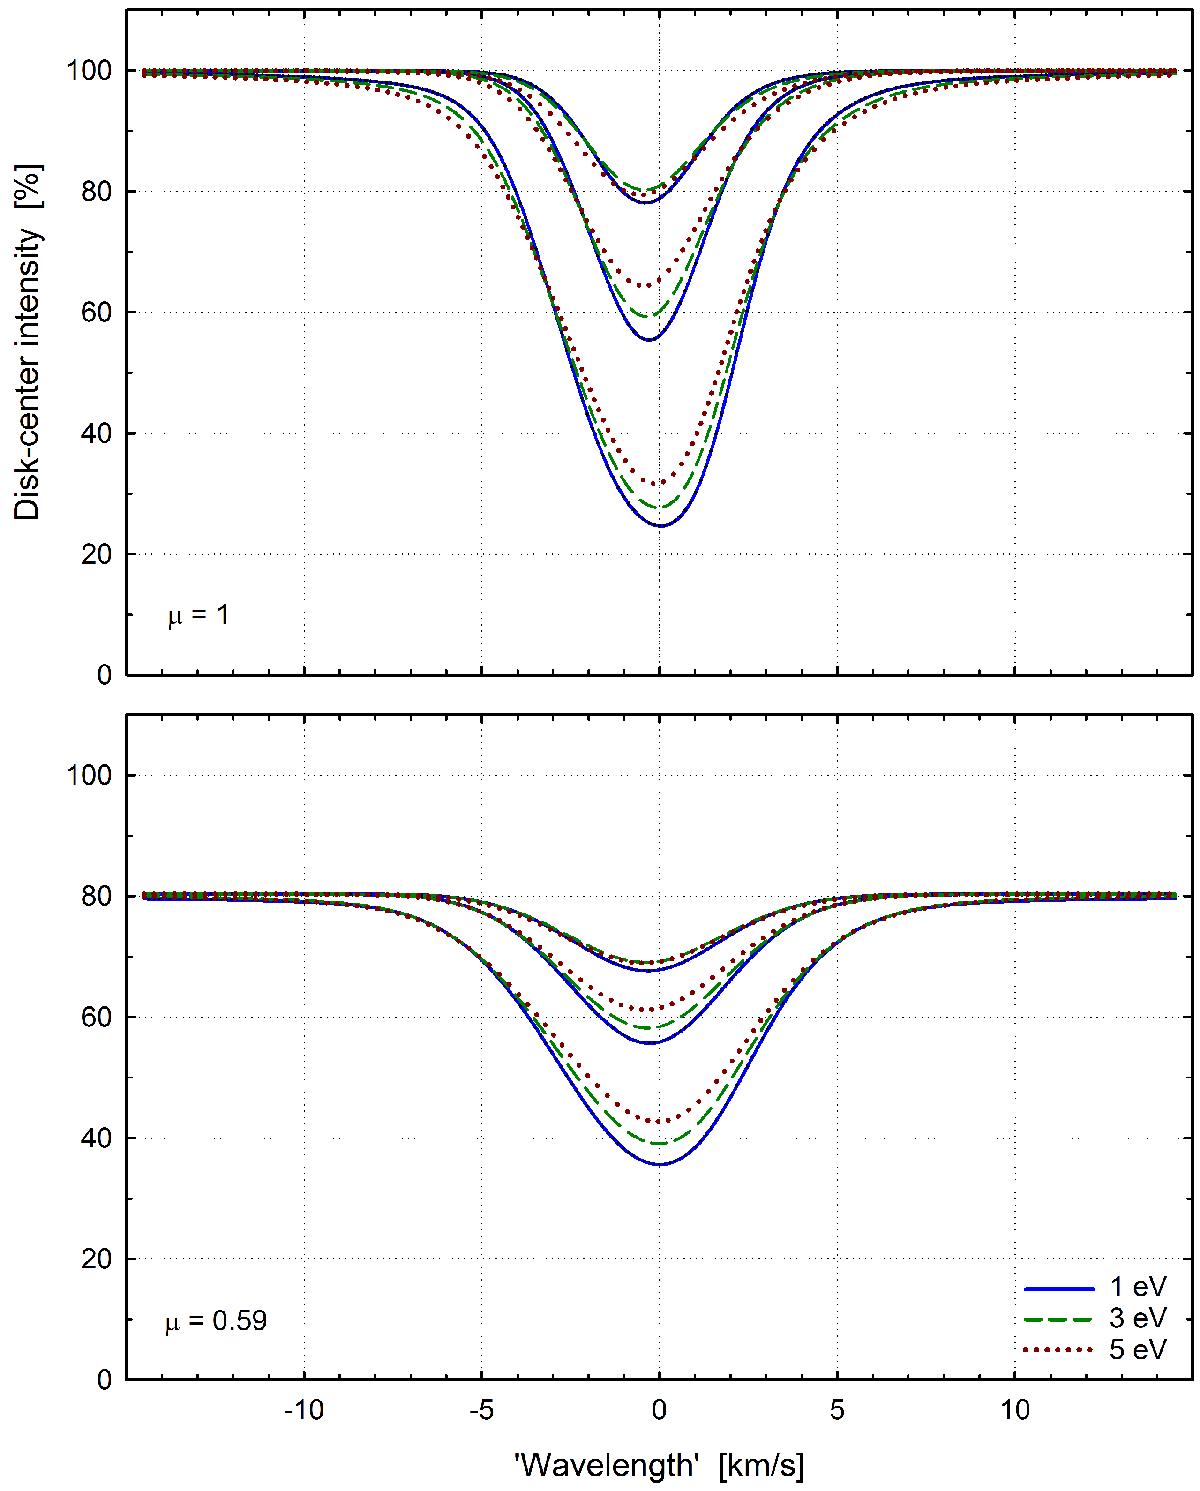
Spectral line properties also depend on the excitation potential: Synthetic Fe I lines for a “Solar G2 V” model. Top: plot of disk center (μ = cos θ = 1.0), three line strengths, and three excitation potentials χ = 1, 3, and 5 eV is shown. Bottom: same for disk position μ = cos θ = 0.59. The decreased intensity reflects the limb darkening at λ = 620 nm. Higher excitation lines tend to be shallower and broader although the exact properties depend on the detailed line formation for each transition.
Current usage metrics show cumulative count of Article Views (full-text article views including HTML views, PDF and ePub downloads, according to the available data) and Abstracts Views on Vision4Press platform.
Data correspond to usage on the plateform after 2015. The current usage metrics is available 48-96 hours after online publication and is updated daily on week days.
Initial download of the metrics may take a while.