Fig. 2
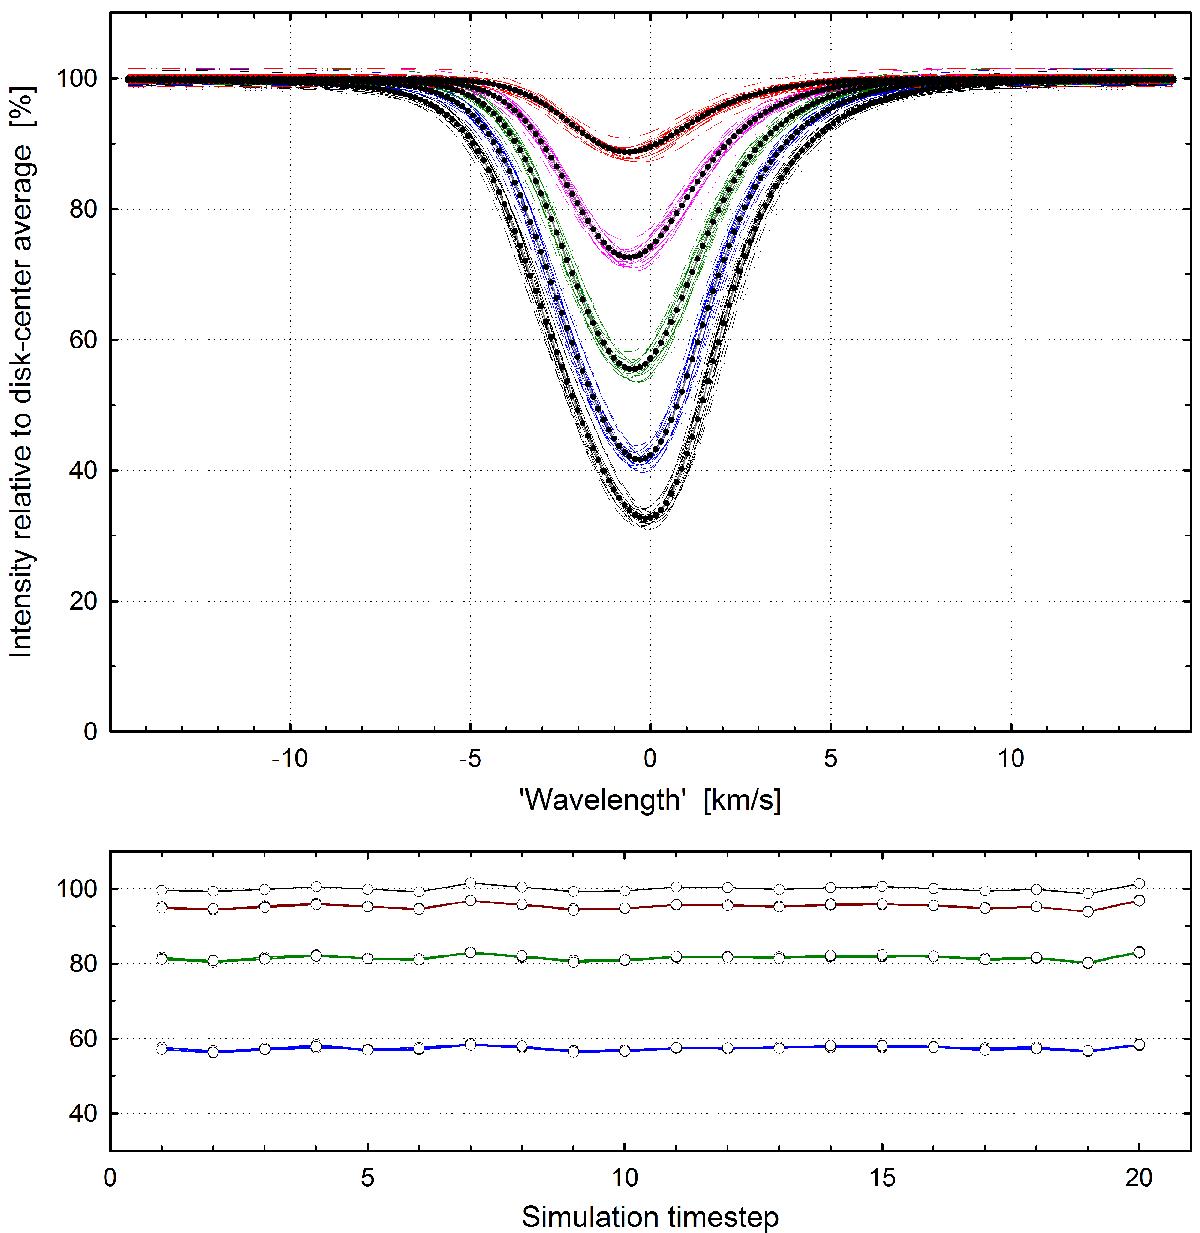
Top: build-up of synthetic Fe I lines at stellar disk center (μ = cosθ = 1.0) from a CO 5BOLD model of a dwarf star with approximate spectral type F7 V (Teff = 6250 K, log 1 [cgs] = 4.5). Thin colored lines are spatial averages over the simulation area for each of 20 temporal snapshots; bold curves are the total averages. All five different line strengths are for λ = 620 nm, χ = 3 eV. The convection patterns especially cause the weaker lines to become asymmetric and wavelength-shifted. Bottom: evolution of the continuum intensity during the simulation sequence for four different center-to-limb positions μ = 1, 0.87, 0.59, 0.21. For off-center positions, slight differences exist among the four different azimuth angles (ψ = 0, π/2, π, 3π/2 rad).
Current usage metrics show cumulative count of Article Views (full-text article views including HTML views, PDF and ePub downloads, according to the available data) and Abstracts Views on Vision4Press platform.
Data correspond to usage on the plateform after 2015. The current usage metrics is available 48-96 hours after online publication and is updated daily on week days.
Initial download of the metrics may take a while.