Fig. 11
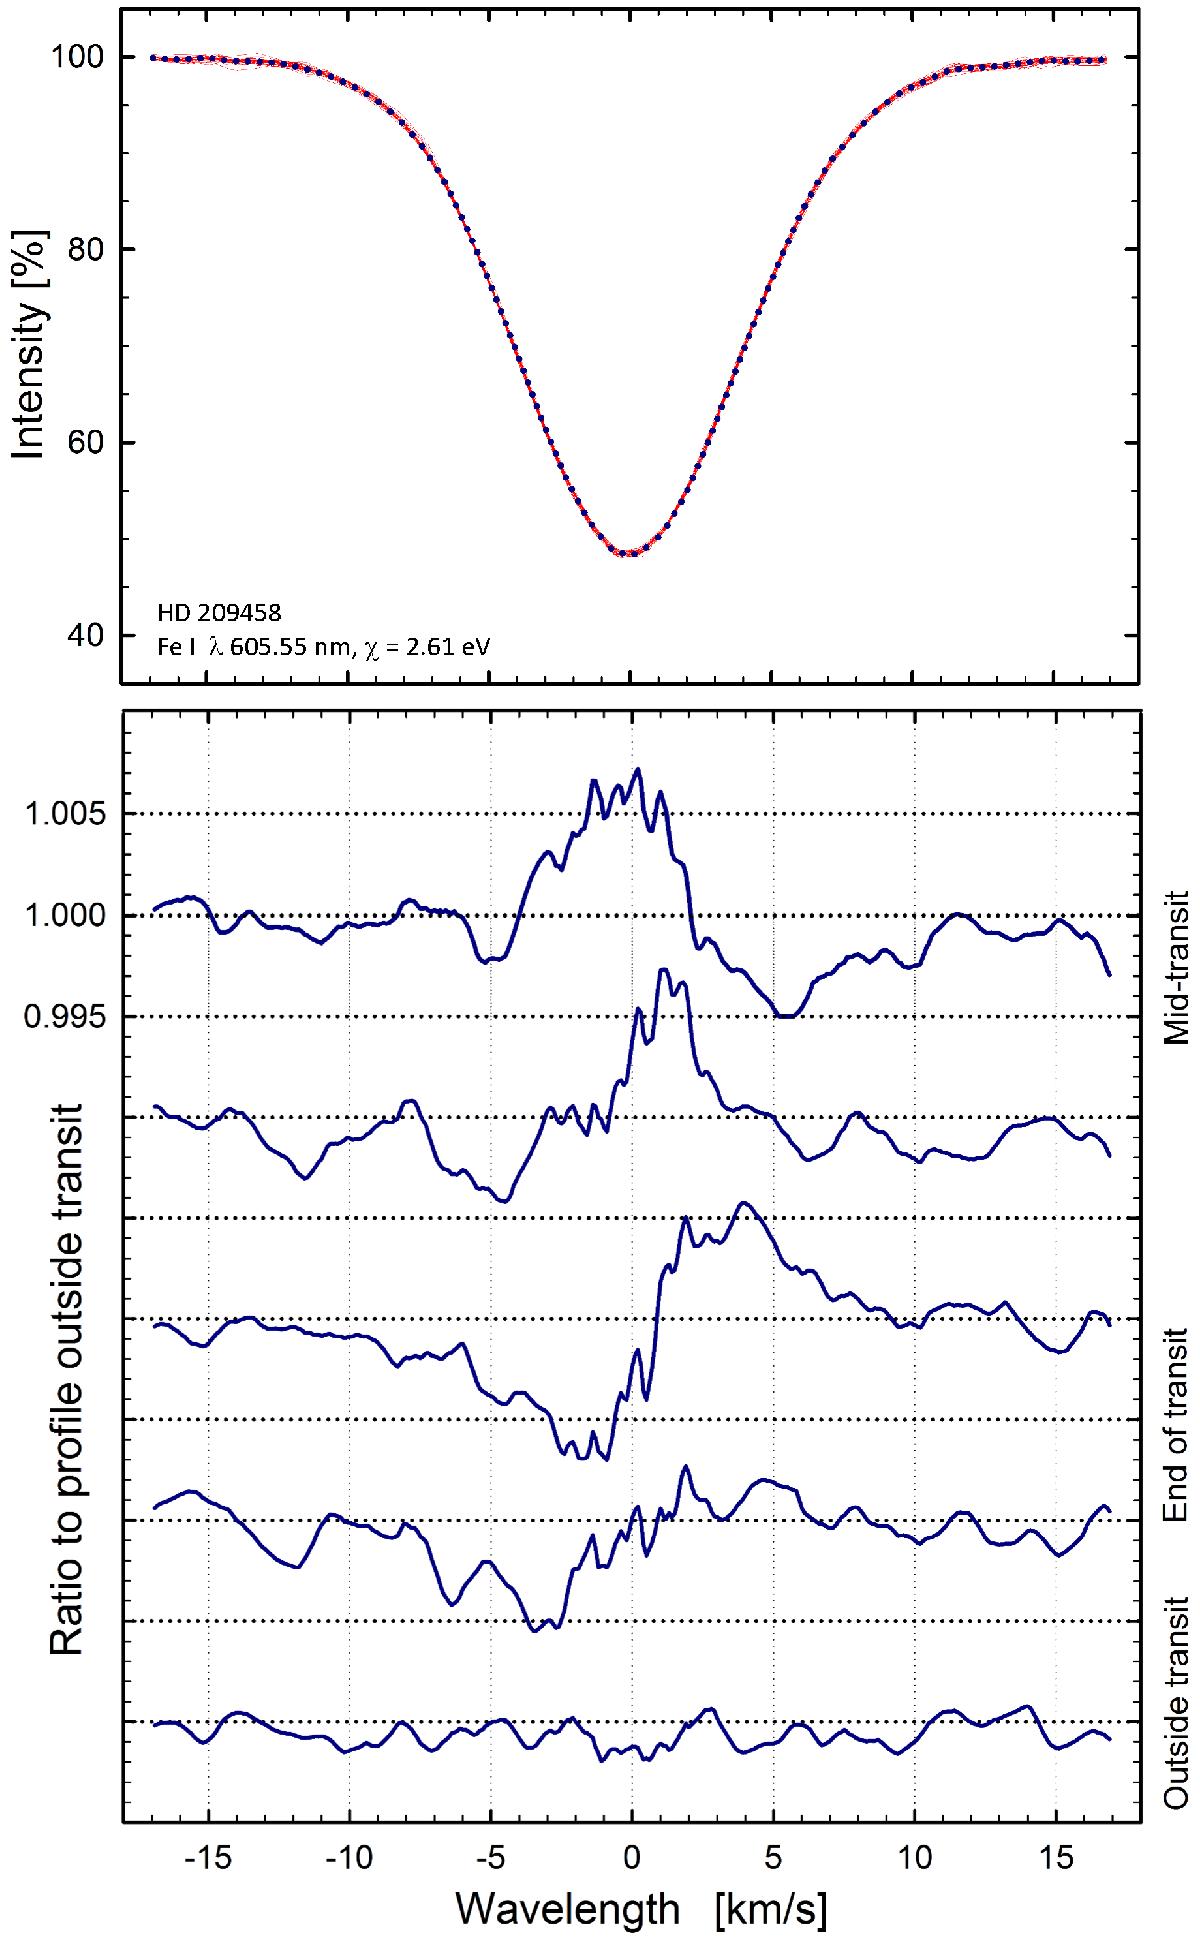
Top: observed line profiles for one photospheric Fe I line in the planet-hosting star HD 209458. The thin red curves are observed profiles from various epochs during the exoplanet transit; the dotted curve is the reference profile from outside transit. Bottom: by averaging data from 11 different Fe I lines, the photometric signal-to-noise ratio approaches what is required to resolve the gradual line profile changes during transit. The line profile ratios are in the same format as the theoretical curves in Figs. 9 and 10.
Current usage metrics show cumulative count of Article Views (full-text article views including HTML views, PDF and ePub downloads, according to the available data) and Abstracts Views on Vision4Press platform.
Data correspond to usage on the plateform after 2015. The current usage metrics is available 48-96 hours after online publication and is updated daily on week days.
Initial download of the metrics may take a while.