Fig. 10
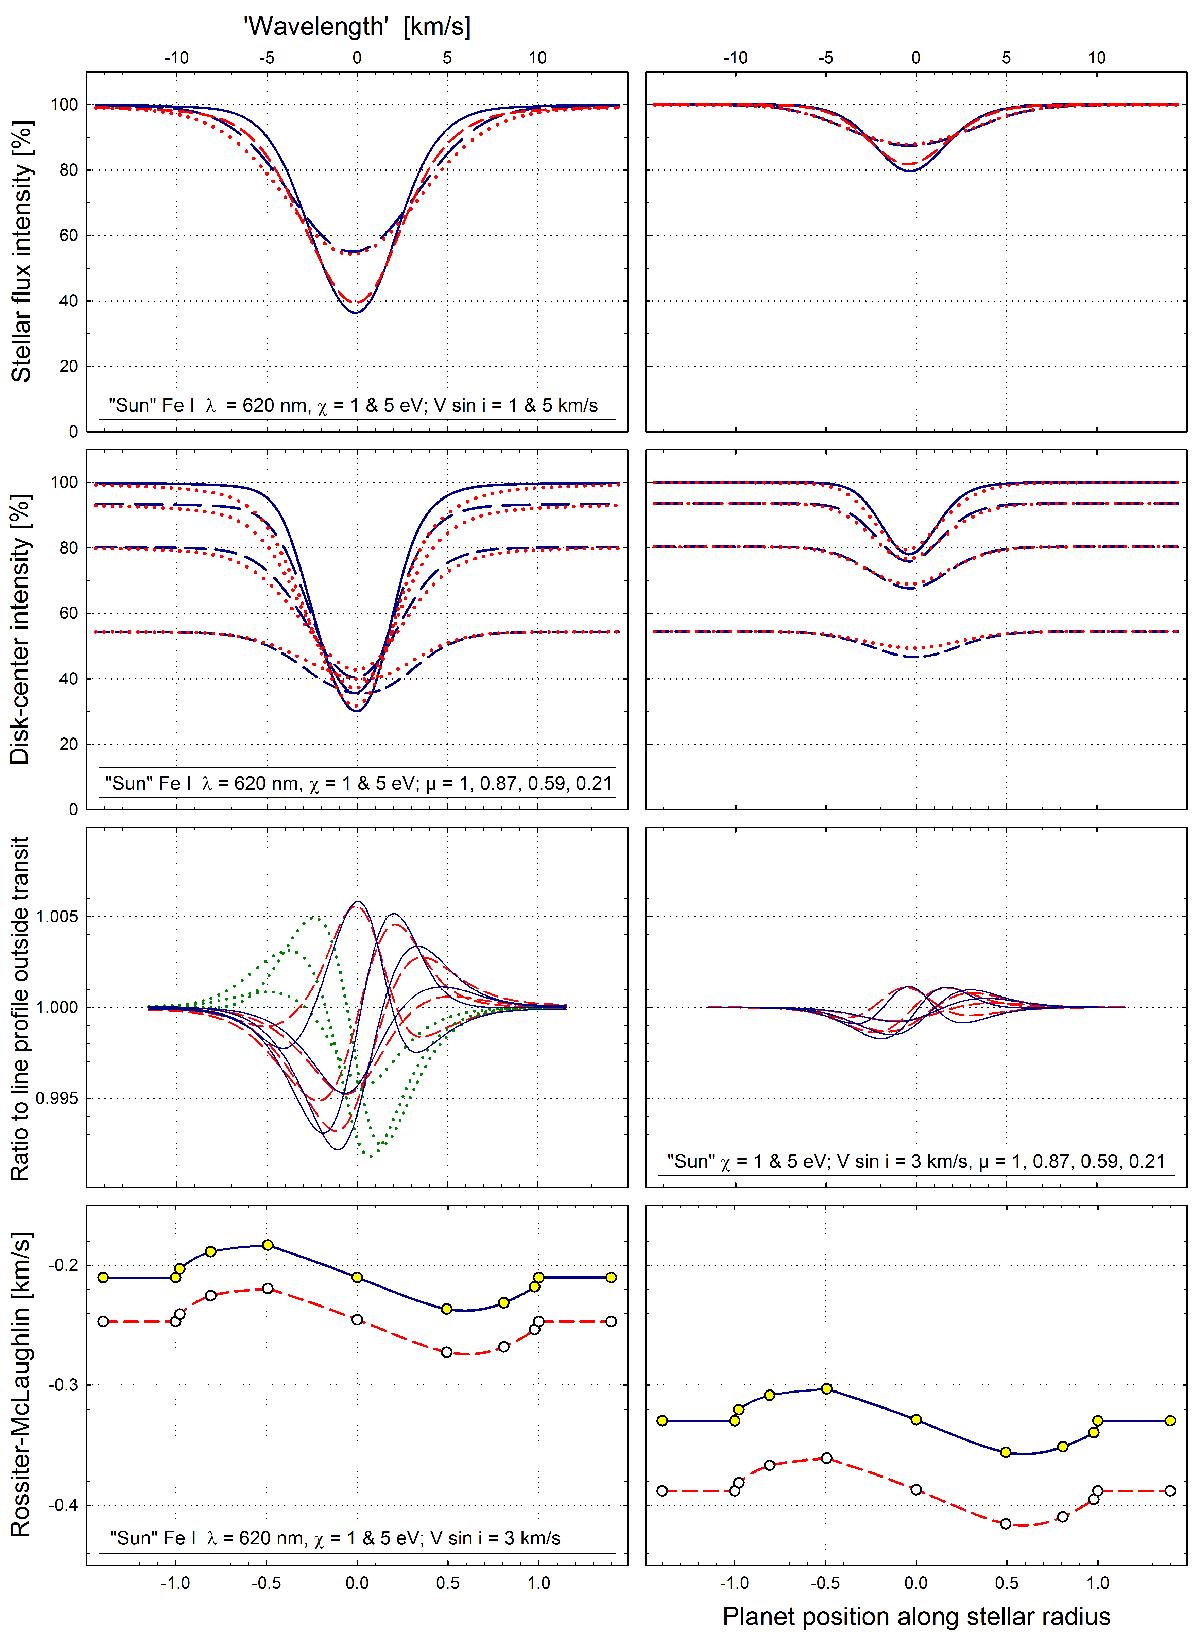
Observable signatures during a transit of an exoplanet covering 1.5% of the stellar surface across a solar-temperature star for differently strong spectral lines, different excitation potentials, and different velocities of stellar rotation. Top row shows synthetic Fe I line profiles in integrated starlight for rotational velocities V sin i = 1, and 5 km s-1, and for excitation potentials χ = 1 eV (blue dashed) and 5 eV (red dotted). The second row shows the spatially resolved lines at different center-to-limb positions and the third row shows the observable ratios between line profiles during and outside transit, as in Fig. 9. The bottom row shows the Rossiter-McLaughlin signal, i.e., the apparent radial velocity of the star relative to its true center-of-mass motion, obtained as a Gaussian fit to the line profile in integrated starlight (however, neglecting gravitational redshift). The displacements between the curves (1 eV – solid blue; 5 eV – dashed red) reflect the dependence of convective blueshift on excitation potential.
Current usage metrics show cumulative count of Article Views (full-text article views including HTML views, PDF and ePub downloads, according to the available data) and Abstracts Views on Vision4Press platform.
Data correspond to usage on the plateform after 2015. The current usage metrics is available 48-96 hours after online publication and is updated daily on week days.
Initial download of the metrics may take a while.