Fig. 6
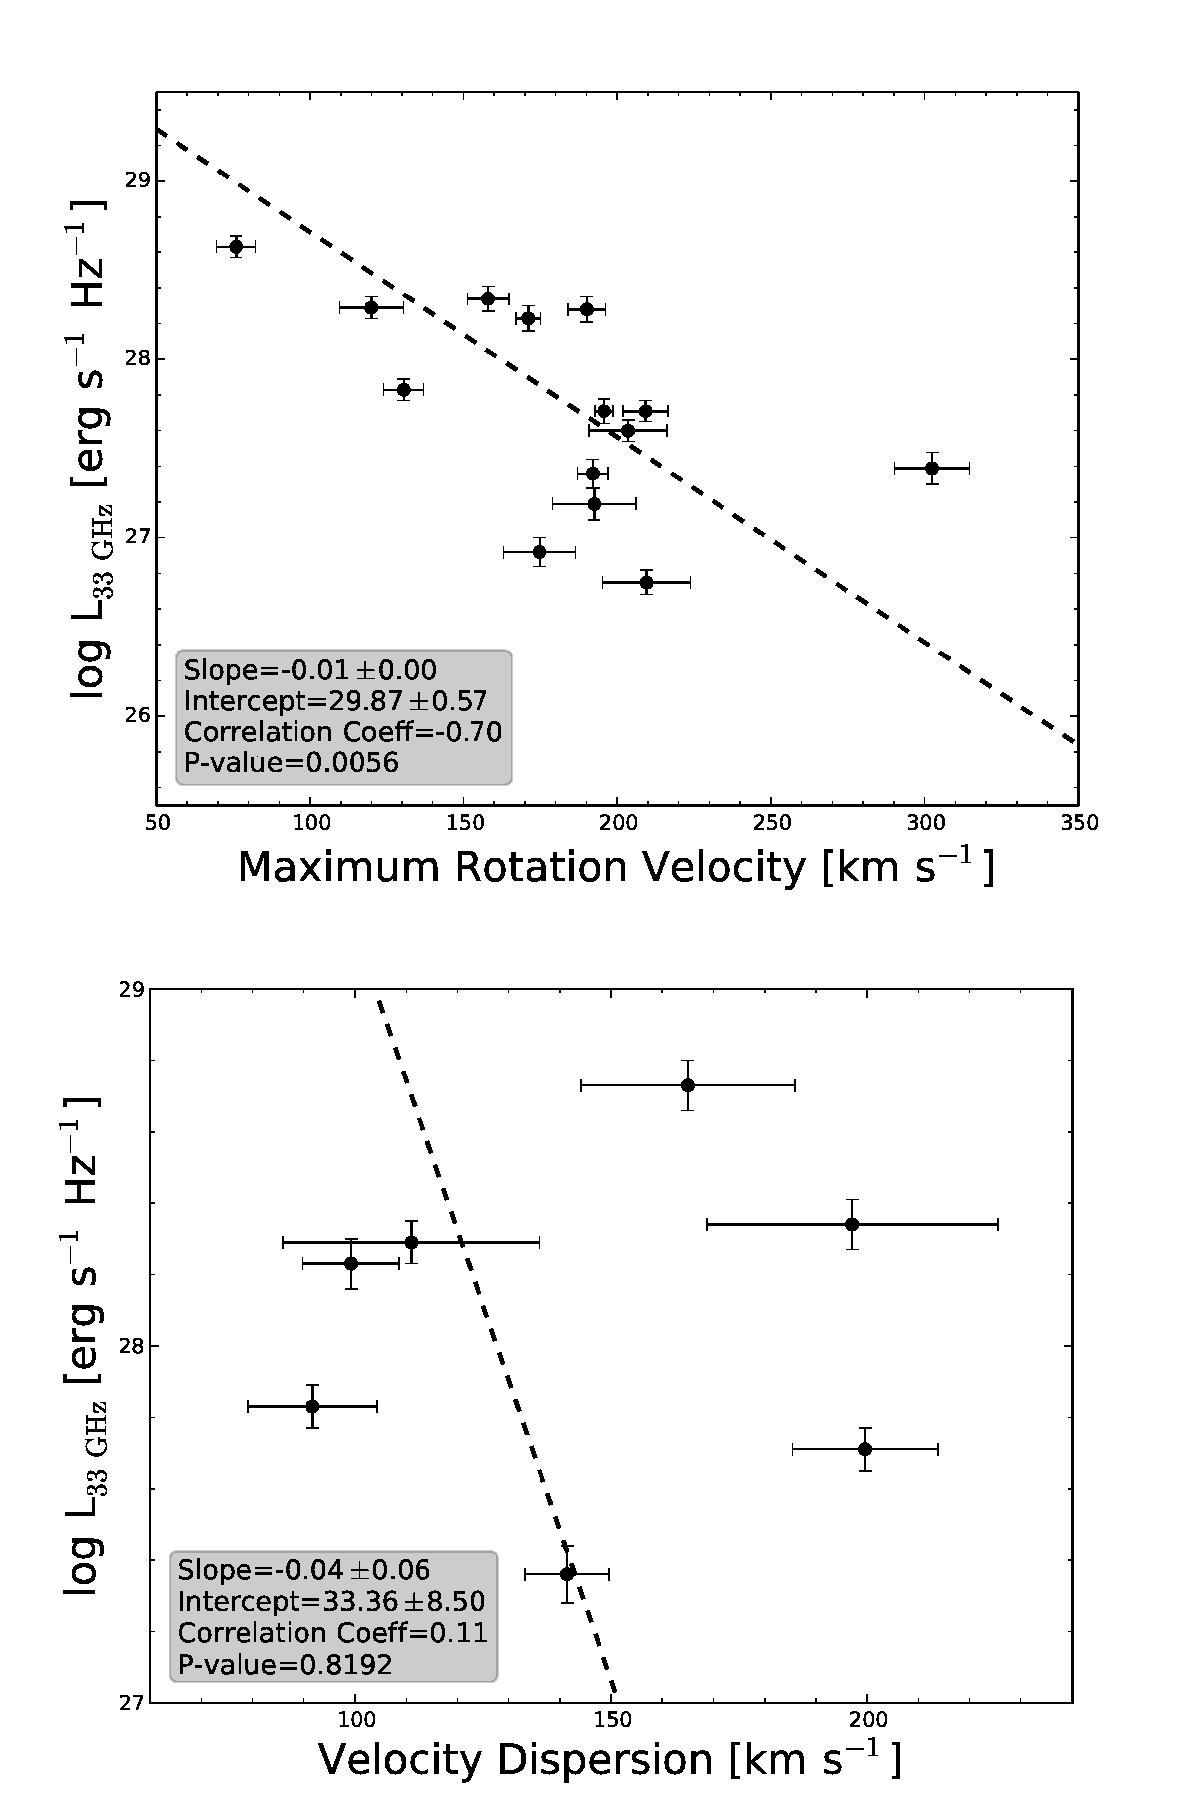
Top: radio continuum versus circular velocity (from HyperLeda). Bottom: radio continuum versus central stellar velocity dispersion. “Central” refers to standardized aperture rnorm of 0.595 h-1 kpc, which is equivalent to an angular diameter of 3.4 arcsec at the distance of the Coma cluster. The lines show linear fits to the data points accounting for errors along both axes. The slope and intercept of the fit, the correlation coefficient, and the P-value of the Spearman test (see also Fig. 5) are shown in a corner of each plot.
Current usage metrics show cumulative count of Article Views (full-text article views including HTML views, PDF and ePub downloads, according to the available data) and Abstracts Views on Vision4Press platform.
Data correspond to usage on the plateform after 2015. The current usage metrics is available 48-96 hours after online publication and is updated daily on week days.
Initial download of the metrics may take a while.