Fig. 5
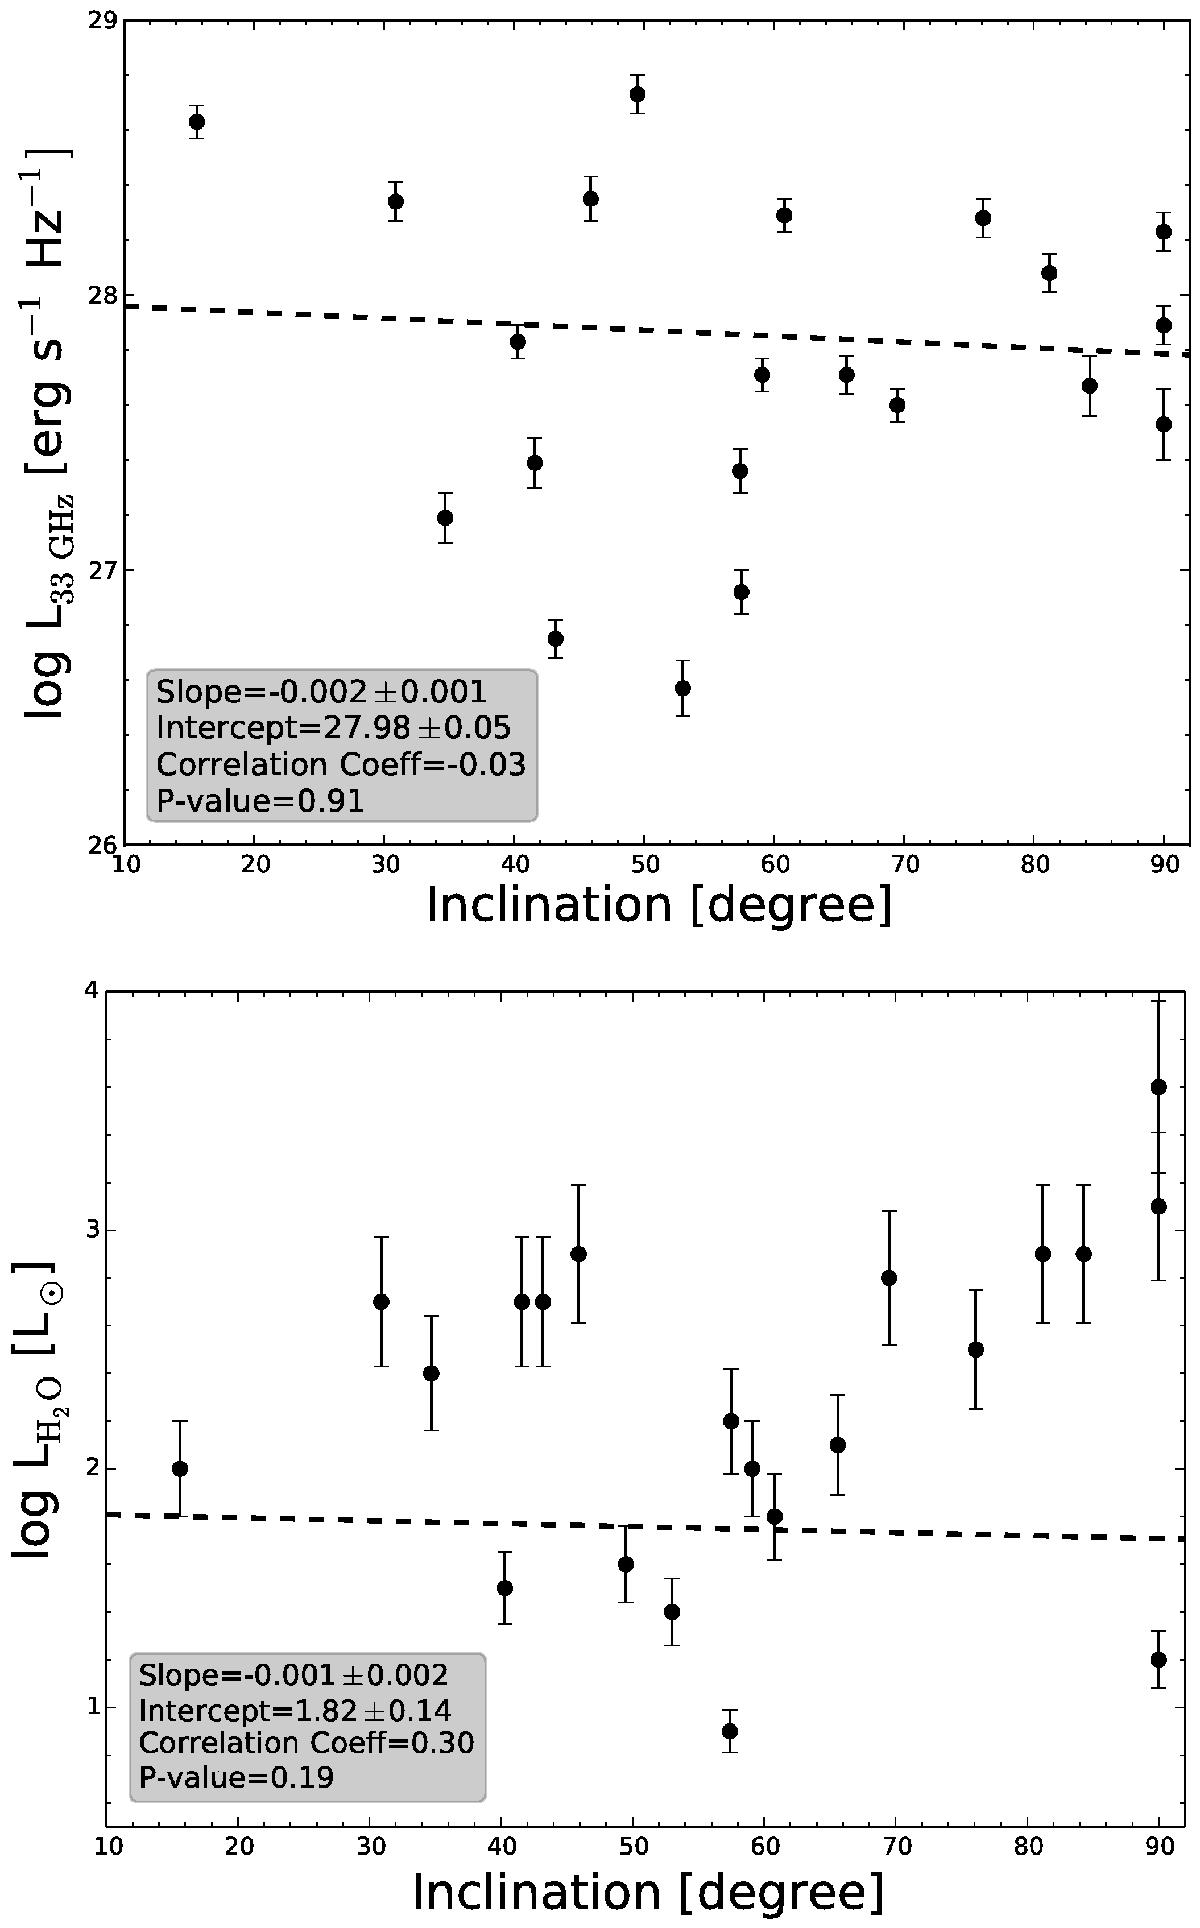
Top: 33 GHz continuum luminosity versus large-scale inclination. Bottom: H2O-maser luminosity versus large-scale inclination of the galaxies. The dashed lines show linear fits to the data points. The slope and intercept of the fits, the correlation coefficient, and the P-value of the Spearman test, indicating the likelihood that the two quantities are unrelated, are indicated in a corner of each panel.
Current usage metrics show cumulative count of Article Views (full-text article views including HTML views, PDF and ePub downloads, according to the available data) and Abstracts Views on Vision4Press platform.
Data correspond to usage on the plateform after 2015. The current usage metrics is available 48-96 hours after online publication and is updated daily on week days.
Initial download of the metrics may take a while.