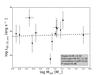
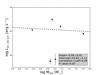
Fig. 10
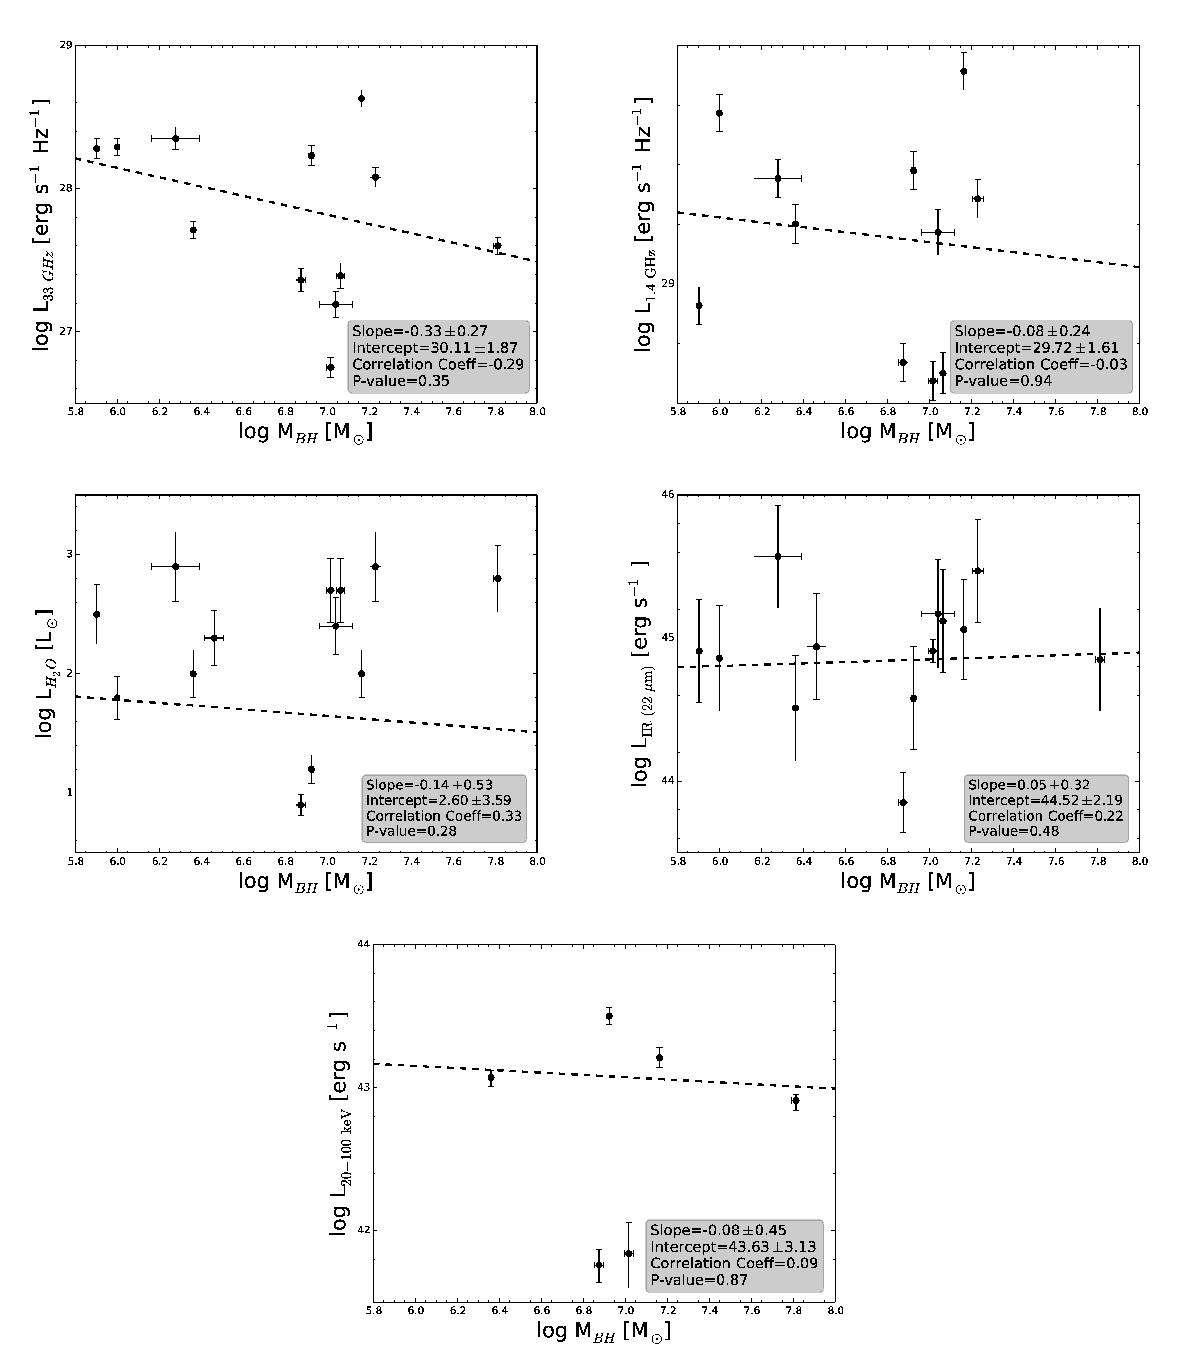
Top left: 33 GHz continuum luminosity versus black hole mass. Top right: 1.4 GHz luminosity versus black hole mass. Middle left: H2O-maser luminosity versus black hole mass. Middle right: IR luminosity (WISE 22 μm data) versus black hole mass. Bottom: hard X-ray luminosity versus black hole mass. Black hole masses are given on a logarithmic scale in units of solar mass, taken from Kuo et al. (2011), Braatz et al. (2015), and Gao et al. (2017). The lines show linear fits to the data. The slope and intercept of the fit, as well as the correlation coefficient and the P-value of the Spearman test (see also Fig. 5) are shown in a lower corner of each panel.
Current usage metrics show cumulative count of Article Views (full-text article views including HTML views, PDF and ePub downloads, according to the available data) and Abstracts Views on Vision4Press platform.
Data correspond to usage on the plateform after 2015. The current usage metrics is available 48-96 hours after online publication and is updated daily on week days.
Initial download of the metrics may take a while.