Fig. 8
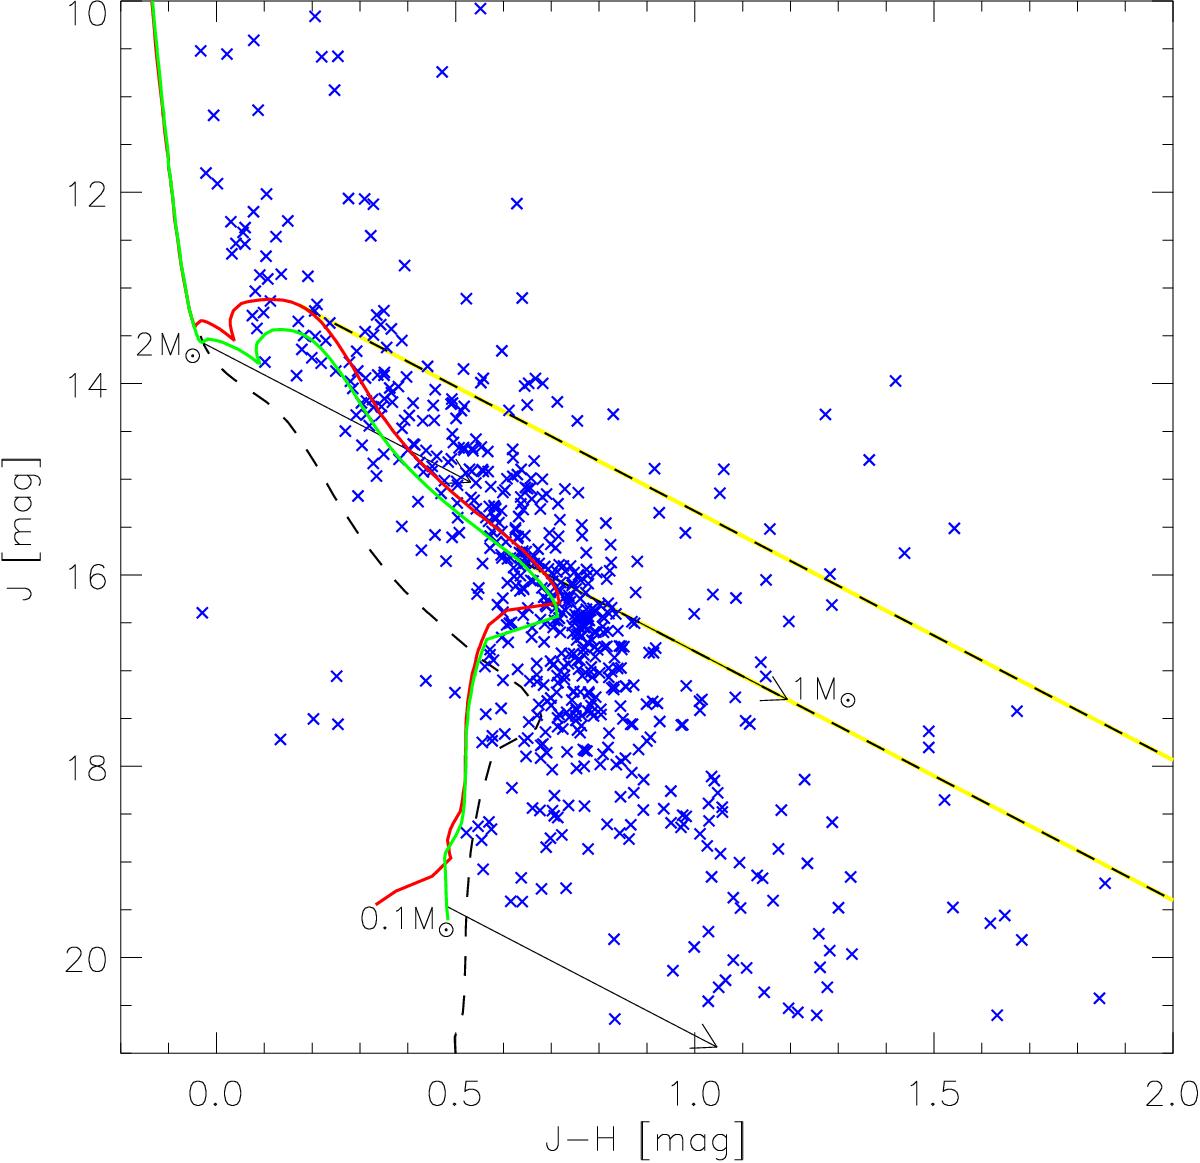
Near-infrared color magnitude diagram of the X-ray detected objects in NGC 3293 (blue crosses). The red and green solid lines show isochrones for stellar ages of 8 Myr and 10 Myr, based on the PARSEC stellar models (Marigo et al. 2017). The black dashed line indicates the main sequence. The arrows indicate reddening vectors for AV = 5 mag starting at the location of 10 Myr old stars with masses of 2 M⊙, 1 M⊙, and 0.1 M⊙. The yellow-and-black dashed lines show the upper and lower limits for the ranges that were used for counting the number of stars in the [1–2] M⊙ interval.
Current usage metrics show cumulative count of Article Views (full-text article views including HTML views, PDF and ePub downloads, according to the available data) and Abstracts Views on Vision4Press platform.
Data correspond to usage on the plateform after 2015. The current usage metrics is available 48-96 hours after online publication and is updated daily on week days.
Initial download of the metrics may take a while.