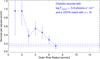
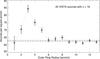
Fig. 7

Top: radial profile of the surface density of Chandra sources in the spatially complete sample that have a VISTA match with J< 18 in different rings around the optical cluster center. The horizontal blue line and the parallel dashed lines show the mean value and the uncertainty of the source density outside the 7 arcmin region. Bottom: radial profile of the surface density of all VISTA source with J< 18 in different rings around the optical cluster center. The horizontal line and the parallel dashed lines show the mean value and the uncertainty of the source density in several comparison fields.
Current usage metrics show cumulative count of Article Views (full-text article views including HTML views, PDF and ePub downloads, according to the available data) and Abstracts Views on Vision4Press platform.
Data correspond to usage on the plateform after 2015. The current usage metrics is available 48-96 hours after online publication and is updated daily on week days.
Initial download of the metrics may take a while.