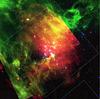
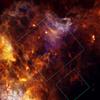
Fig. A.1

Left: three-color composite image of the NGC 3293 area, showing the VST r-band image (from the VPHAS+ survey) in the blue color channel, the Spitzer IRAC 8 μm image (retrieved from the Spitzer archive) in green, and the Spitzer MIPS 24 μm image in red. The Spitzer images cover only parts of the full area shown in this image. North is up and east to the left. The cyan rectangle marks the 17′ × 17′ area covered by our Chandra observation with the ACIS-I array, the lower cyan rectangle (extending beyond the edge of the image) marks the area covered by the single active ACIS-S detector. Right: three-color composite image showing the Herschel PACS 70 μm image in the blue color channel, the PACS 160 μm image in green, and the SPIRE 250 μm image in red; these Herschel maps were obtained as part of the Hi-Gal survey and were retrieved from the archive. The B-type stars listed in Evans et al. (2005) are marked by blue crosses. The cyan rectangles mark again the Chandra ACIS field of view.
Current usage metrics show cumulative count of Article Views (full-text article views including HTML views, PDF and ePub downloads, according to the available data) and Abstracts Views on Vision4Press platform.
Data correspond to usage on the plateform after 2015. The current usage metrics is available 48-96 hours after online publication and is updated daily on week days.
Initial download of the metrics may take a while.