Fig. 5
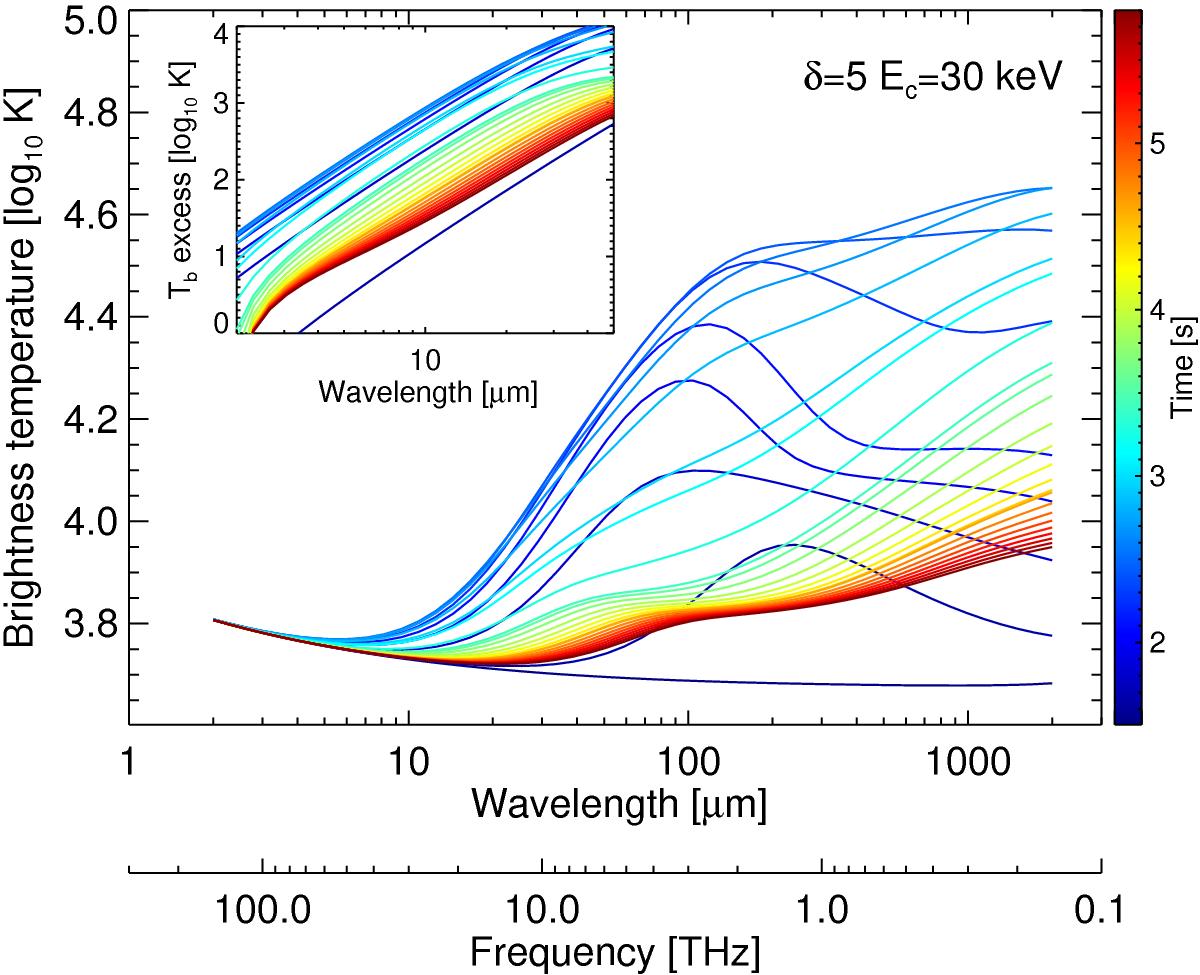
Evolution of the IR flare Tb spectrum for the model with δ = 5 and Ec = 30 keV. For λ> 50 μm, the brightness temperature tends to reflect the actual electron temperature in the optically-thick upper chromosphere. The inset planel shows the flare excess emission, after subtracting the pre-flare spectrum. This highlights the positive slope of the short-wavelength branch, Tb(ν) ∝ ν2, that can be identified with the Rayleigh-Jeans law expected from an optically-thin slab.
Current usage metrics show cumulative count of Article Views (full-text article views including HTML views, PDF and ePub downloads, according to the available data) and Abstracts Views on Vision4Press platform.
Data correspond to usage on the plateform after 2015. The current usage metrics is available 48-96 hours after online publication and is updated daily on week days.
Initial download of the metrics may take a while.