Fig. 4
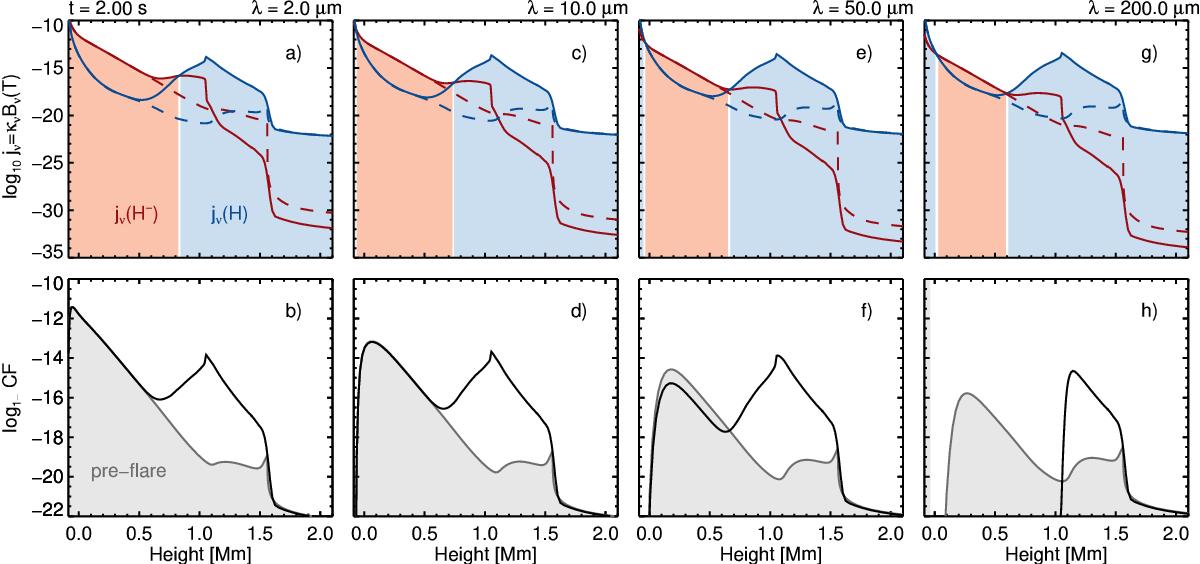
Upper row: neutral free-free (H−) and ion free-free emissivities for the model with Ec = 20 keV and δ = 5, observed at t = 2.0 s, at each of four wavelengths. Red shading indicates neutral free-free dominance, and blue shading ion free-free dominance. The lower row shows the corresponding contribution functions, showing the enhancement of the optical depth at longer wavelengths as the ion free-free opacity increases. For these parameters, panel f) shows the chromosphere to become completely opaque by 200 μm. The dashed lines show the pre-flare emissivities.
Current usage metrics show cumulative count of Article Views (full-text article views including HTML views, PDF and ePub downloads, according to the available data) and Abstracts Views on Vision4Press platform.
Data correspond to usage on the plateform after 2015. The current usage metrics is available 48-96 hours after online publication and is updated daily on week days.
Initial download of the metrics may take a while.