Fig. 1
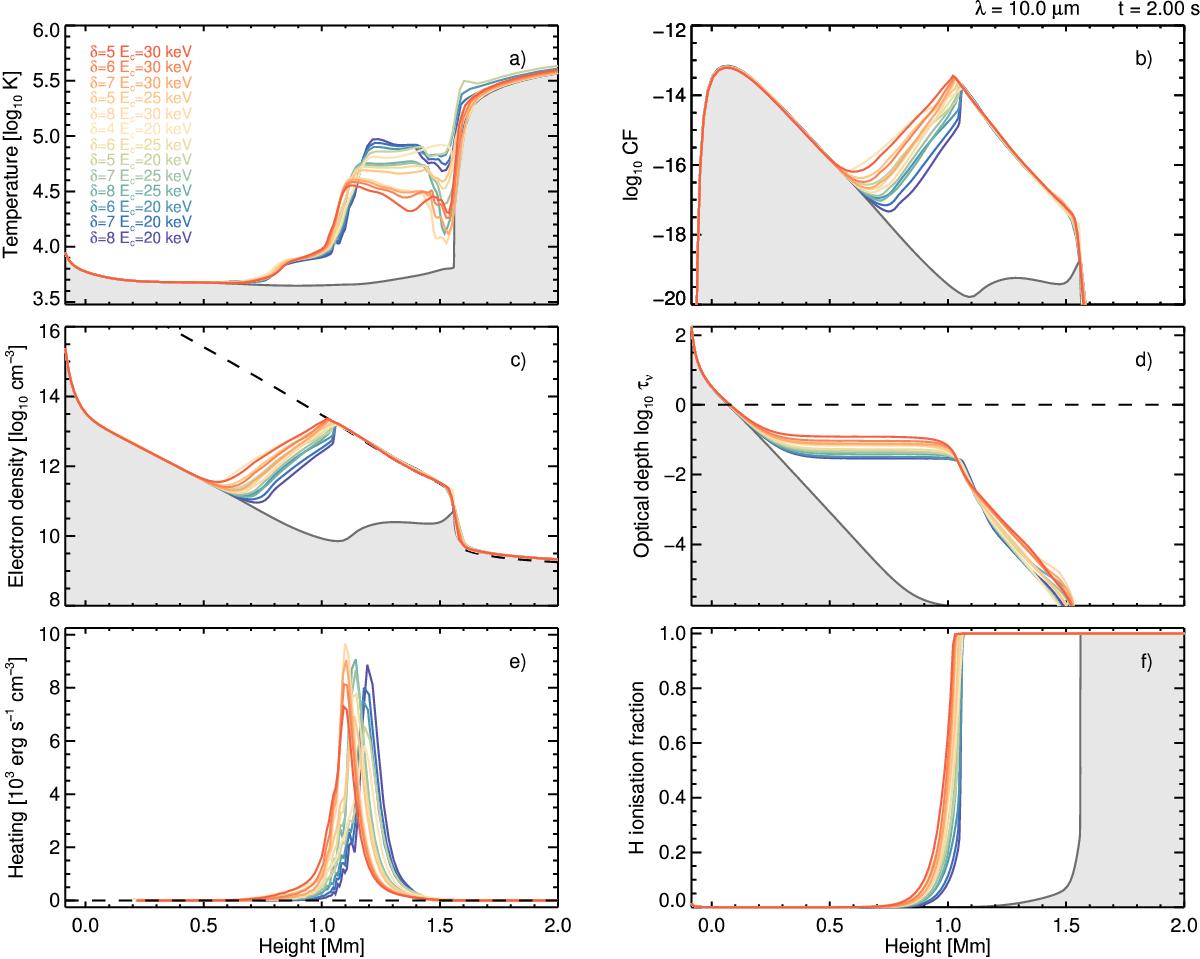
The RADYN quiescent atmosphere (grey) and an overview of all of the model results for 10 μm continuum, evaluated at peak energy input time (2 s). The top row shows temperature and contribution function (CF) while the middle row displays electron density and optical depth. The dashed line shows all models to lie below τ = 1 at this wavelength. The bottom row shows the heating rate and the resulting ionisation fraction for hydrogen. Model colour-coding corresponds roughly to the number of electrons at 50 keV, with red being highest.
Current usage metrics show cumulative count of Article Views (full-text article views including HTML views, PDF and ePub downloads, according to the available data) and Abstracts Views on Vision4Press platform.
Data correspond to usage on the plateform after 2015. The current usage metrics is available 48-96 hours after online publication and is updated daily on week days.
Initial download of the metrics may take a while.