Free Access
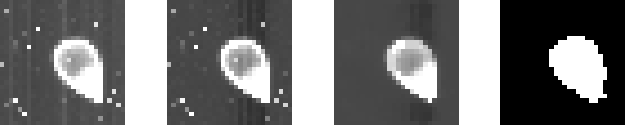
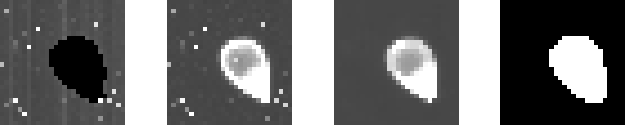
Fig. 6
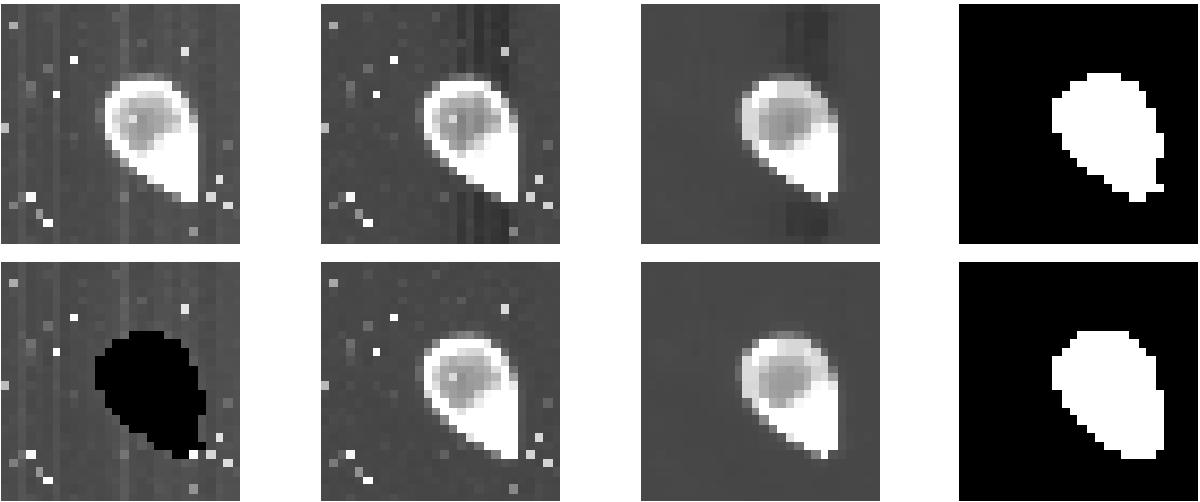
Iterative detection of stellar area. Top row: first iteration, bottom row: second iteration. From left to right the same four steps as in Fig. 5 are shown. The only difference is the leftmost image, in which the stellar area is masked as black (and ignored in calculations) in the second iteration.
This figure is made of several images, please see below:
Current usage metrics show cumulative count of Article Views (full-text article views including HTML views, PDF and ePub downloads, according to the available data) and Abstracts Views on Vision4Press platform.
Data correspond to usage on the plateform after 2015. The current usage metrics is available 48-96 hours after online publication and is updated daily on week days.
Initial download of the metrics may take a while.