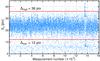
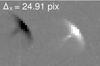
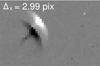
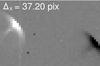
Fig. 13

Classification of images based on the value of Δx. The top plot shows Δx for 19 000 UBr measurements of HD 138690 (γ Lup) in the Sco I field. The two horizontal lines indicate the high (Δhigh = 36 pix = 0.75X, X = 48 pix) and low (Δlow = 12 pix = 0.25X) cut-off thresholds. The three images shown below correspond to three cases, from left to right: useful image (Δlow< Δx = 24.91 pix < Δhigh); image with overlapping profiles (Δx = 2.99 pix < Δlow); image with profiles too far from each other (Δx = 37.20 pix > Δhigh).
Current usage metrics show cumulative count of Article Views (full-text article views including HTML views, PDF and ePub downloads, according to the available data) and Abstracts Views on Vision4Press platform.
Data correspond to usage on the plateform after 2015. The current usage metrics is available 48-96 hours after online publication and is updated daily on week days.
Initial download of the metrics may take a while.