Fig. 9
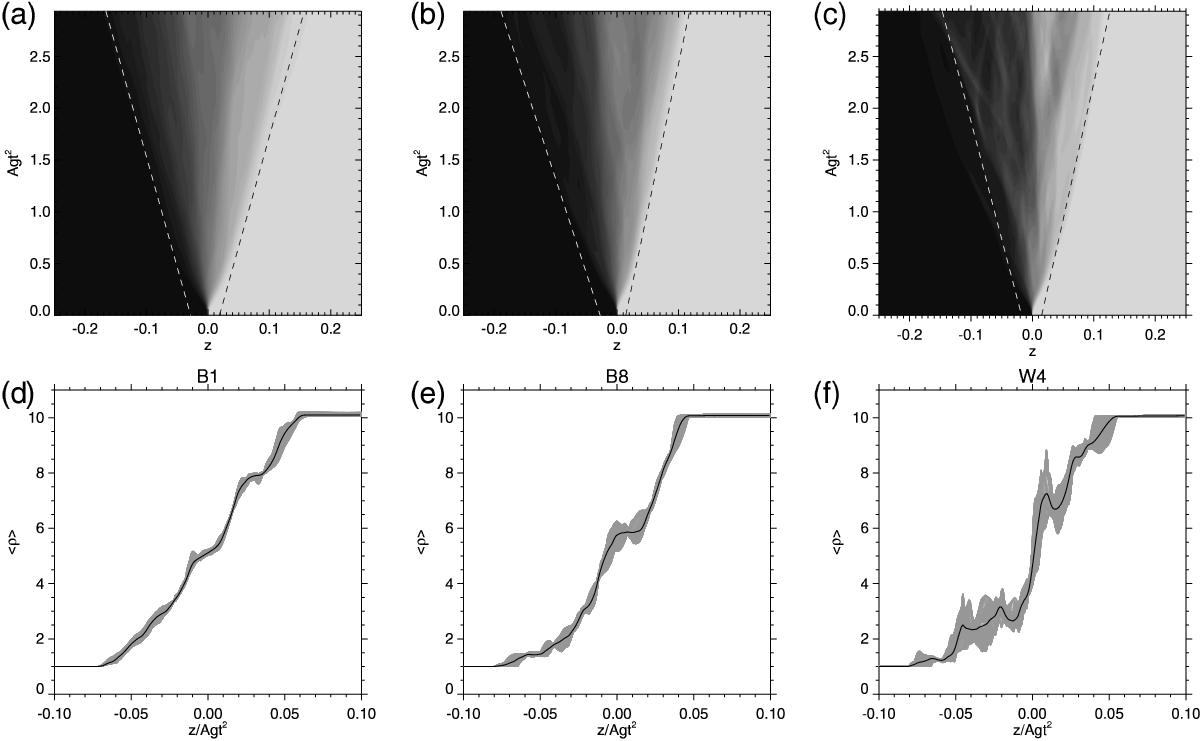
Panel a: contour plot of the horizontal mean of the density for B1. Panel b: same for B8. Panel c: same for W4. The dashed white and black lines signify α = −0.047 and α = 0.047, respectively, for panel a, α = −0.055 and α = 0.0354 for panel b, and α = −0.044 and α = 0.038 for panel c. Panel d: mean density distribution plotted against z/Agt2 for the final 200 snapshots of the simulation for B1. Panel e: same but for B8. Panel f: same but for W4. Note that the values that would be calculated for α from this figure are over estimates due to the initial expansion of the system.
Current usage metrics show cumulative count of Article Views (full-text article views including HTML views, PDF and ePub downloads, according to the available data) and Abstracts Views on Vision4Press platform.
Data correspond to usage on the plateform after 2015. The current usage metrics is available 48-96 hours after online publication and is updated daily on week days.
Initial download of the metrics may take a while.