Fig. 6
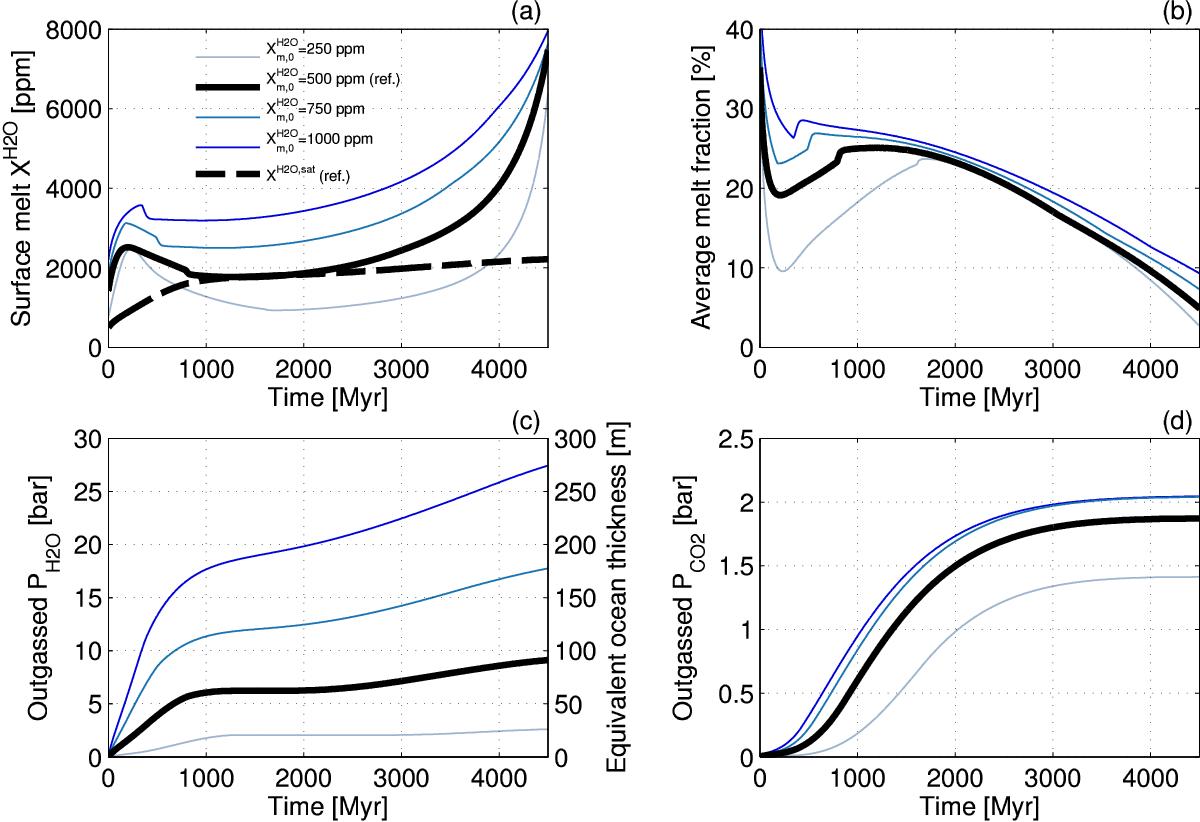
Extraction and outgassing evolution of H2O and CO2 for models with initial water concentrations (![]() ) between 250 and 1000 ppm, an initial mantle temperature of 1700 K, and an oxygen fugacity at the IW buffer. Panel a: Concentration of H2O in the extracted melt (solid lines) and, for the reference model only, concentration of water at saturation (dashed line) are shown; b) average melt fraction is shown; c) partial pressure of outgassed H2O (also expressed as equivalent ocean thickness) is shown; d) partial pressure of outgassed CO2 is shown.
) between 250 and 1000 ppm, an initial mantle temperature of 1700 K, and an oxygen fugacity at the IW buffer. Panel a: Concentration of H2O in the extracted melt (solid lines) and, for the reference model only, concentration of water at saturation (dashed line) are shown; b) average melt fraction is shown; c) partial pressure of outgassed H2O (also expressed as equivalent ocean thickness) is shown; d) partial pressure of outgassed CO2 is shown.
Current usage metrics show cumulative count of Article Views (full-text article views including HTML views, PDF and ePub downloads, according to the available data) and Abstracts Views on Vision4Press platform.
Data correspond to usage on the plateform after 2015. The current usage metrics is available 48-96 hours after online publication and is updated daily on week days.
Initial download of the metrics may take a while.