Fig. 5
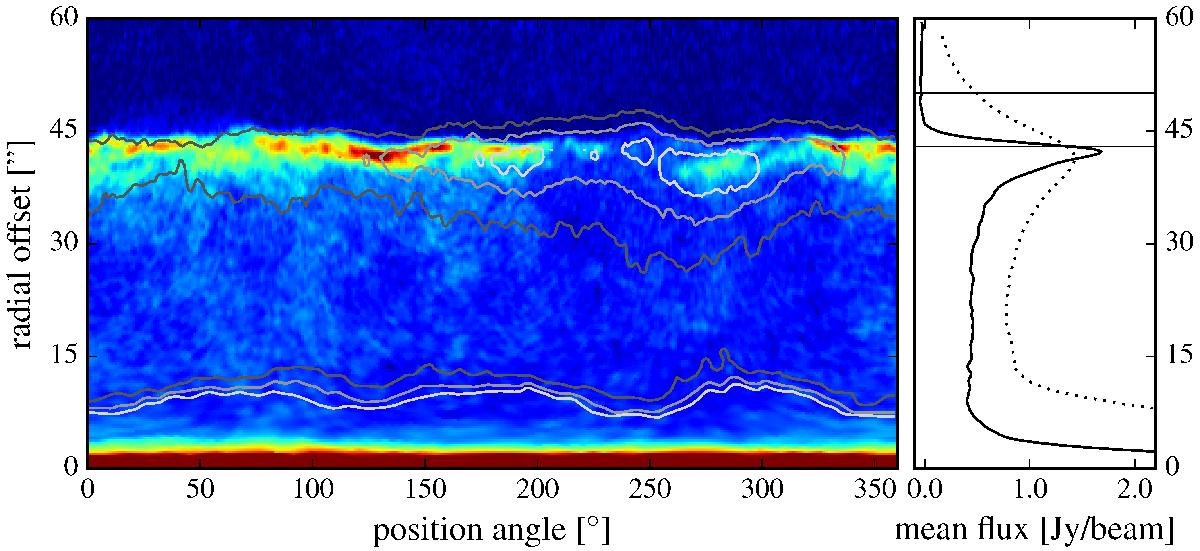
U Ant 12CO(2–1) spectrally integrated data mapped to polar coordinates over plotted with PACS 70 μm contours. The graph to the right depicts azimuthally averaged flux in the ALMA (full) and the Herschel (dashed) data. The two horizontal lines at 43 and 50′′ indicate the radial positions of shells 3 and 4 as discussed in Maercker et al. (2010).
Current usage metrics show cumulative count of Article Views (full-text article views including HTML views, PDF and ePub downloads, according to the available data) and Abstracts Views on Vision4Press platform.
Data correspond to usage on the plateform after 2015. The current usage metrics is available 48-96 hours after online publication and is updated daily on week days.
Initial download of the metrics may take a while.